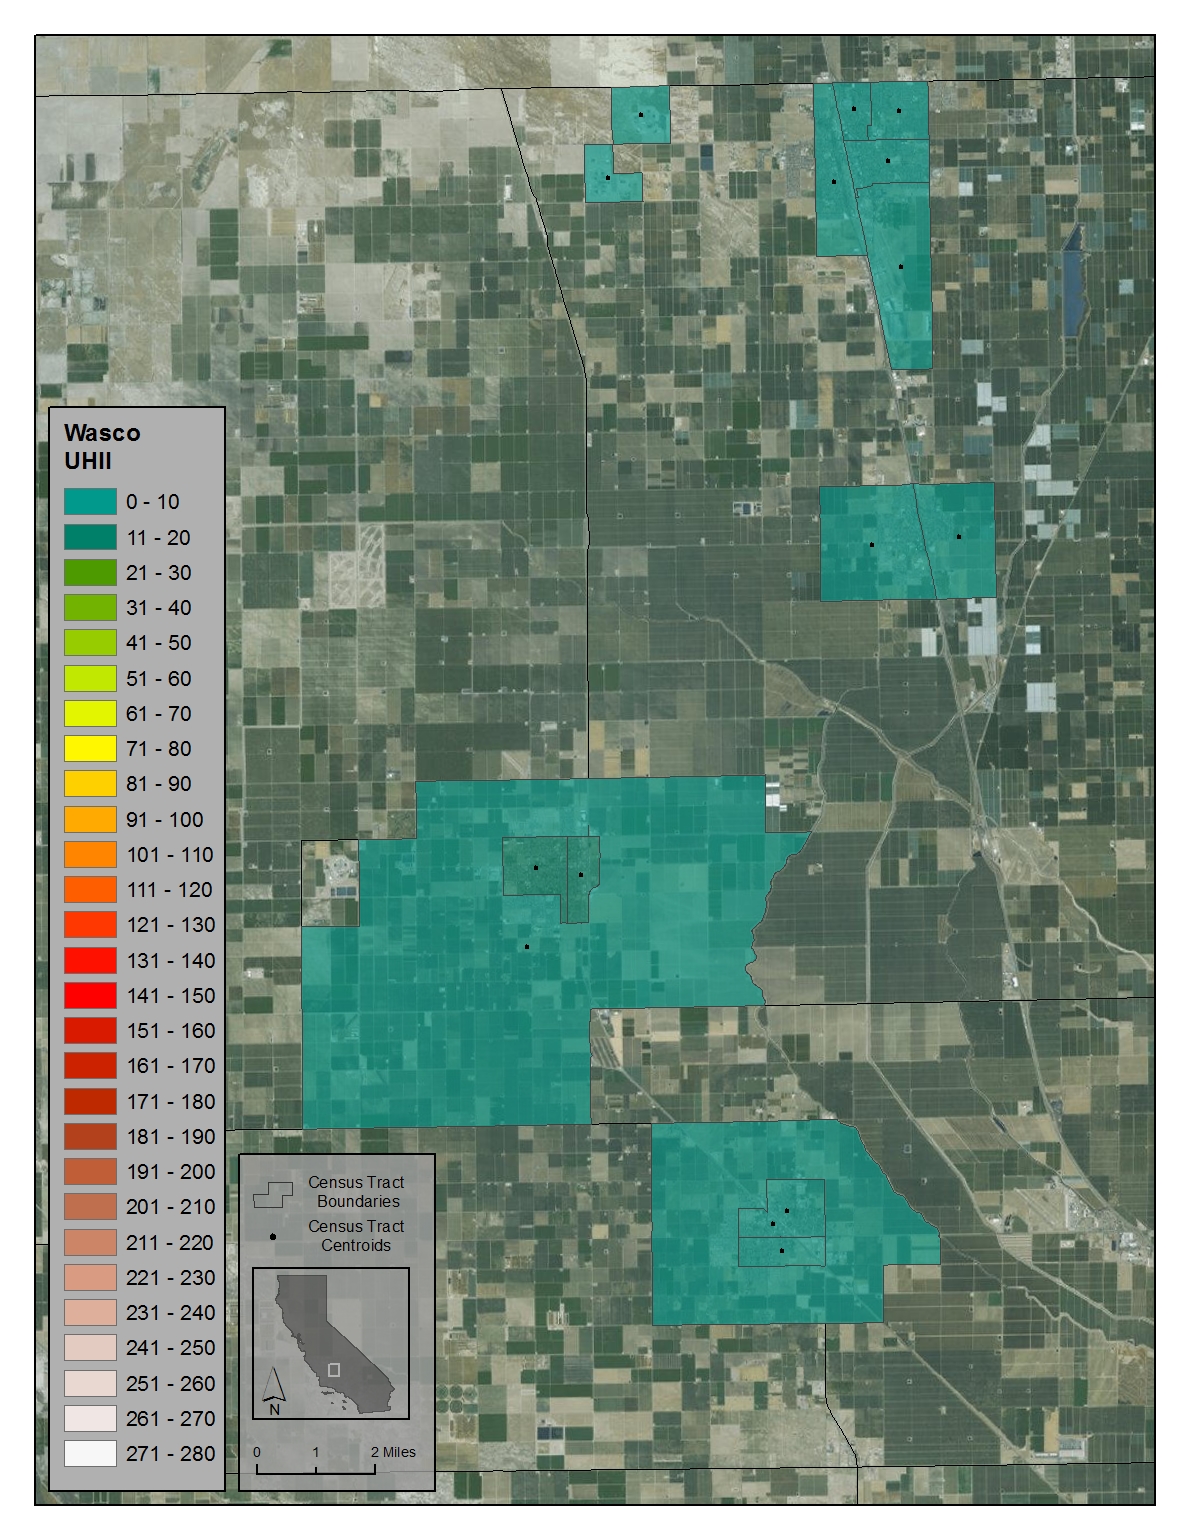
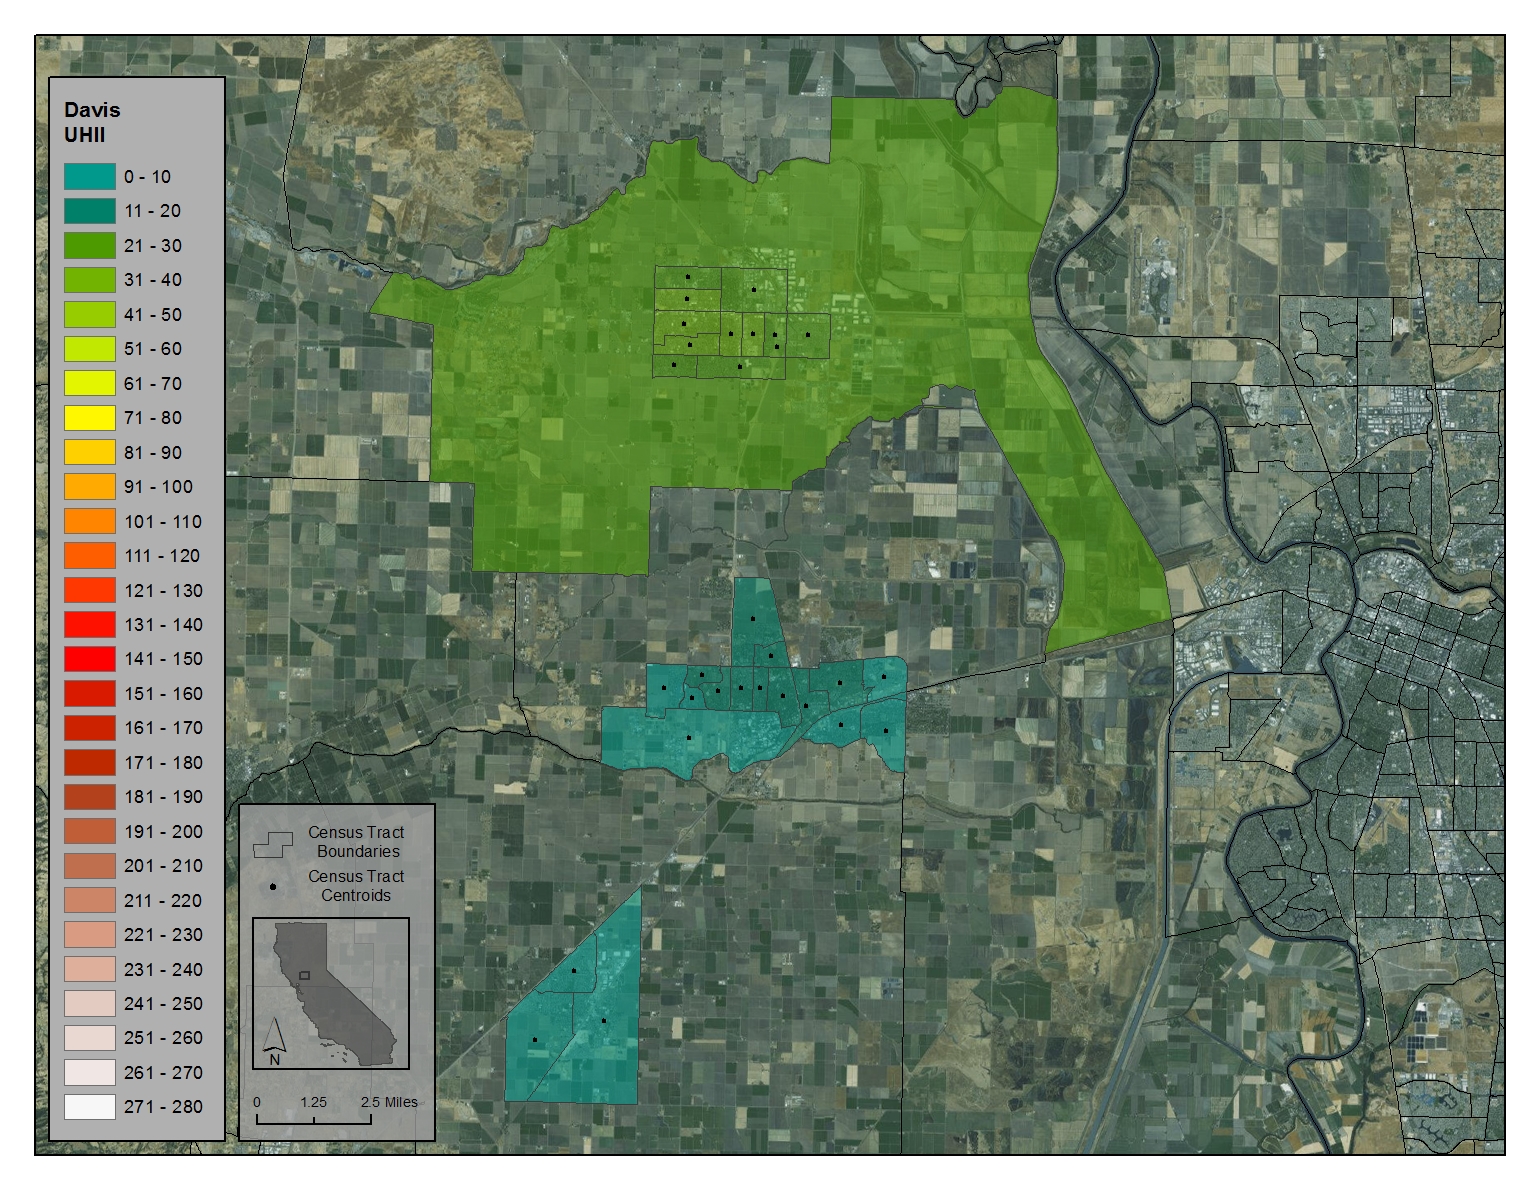
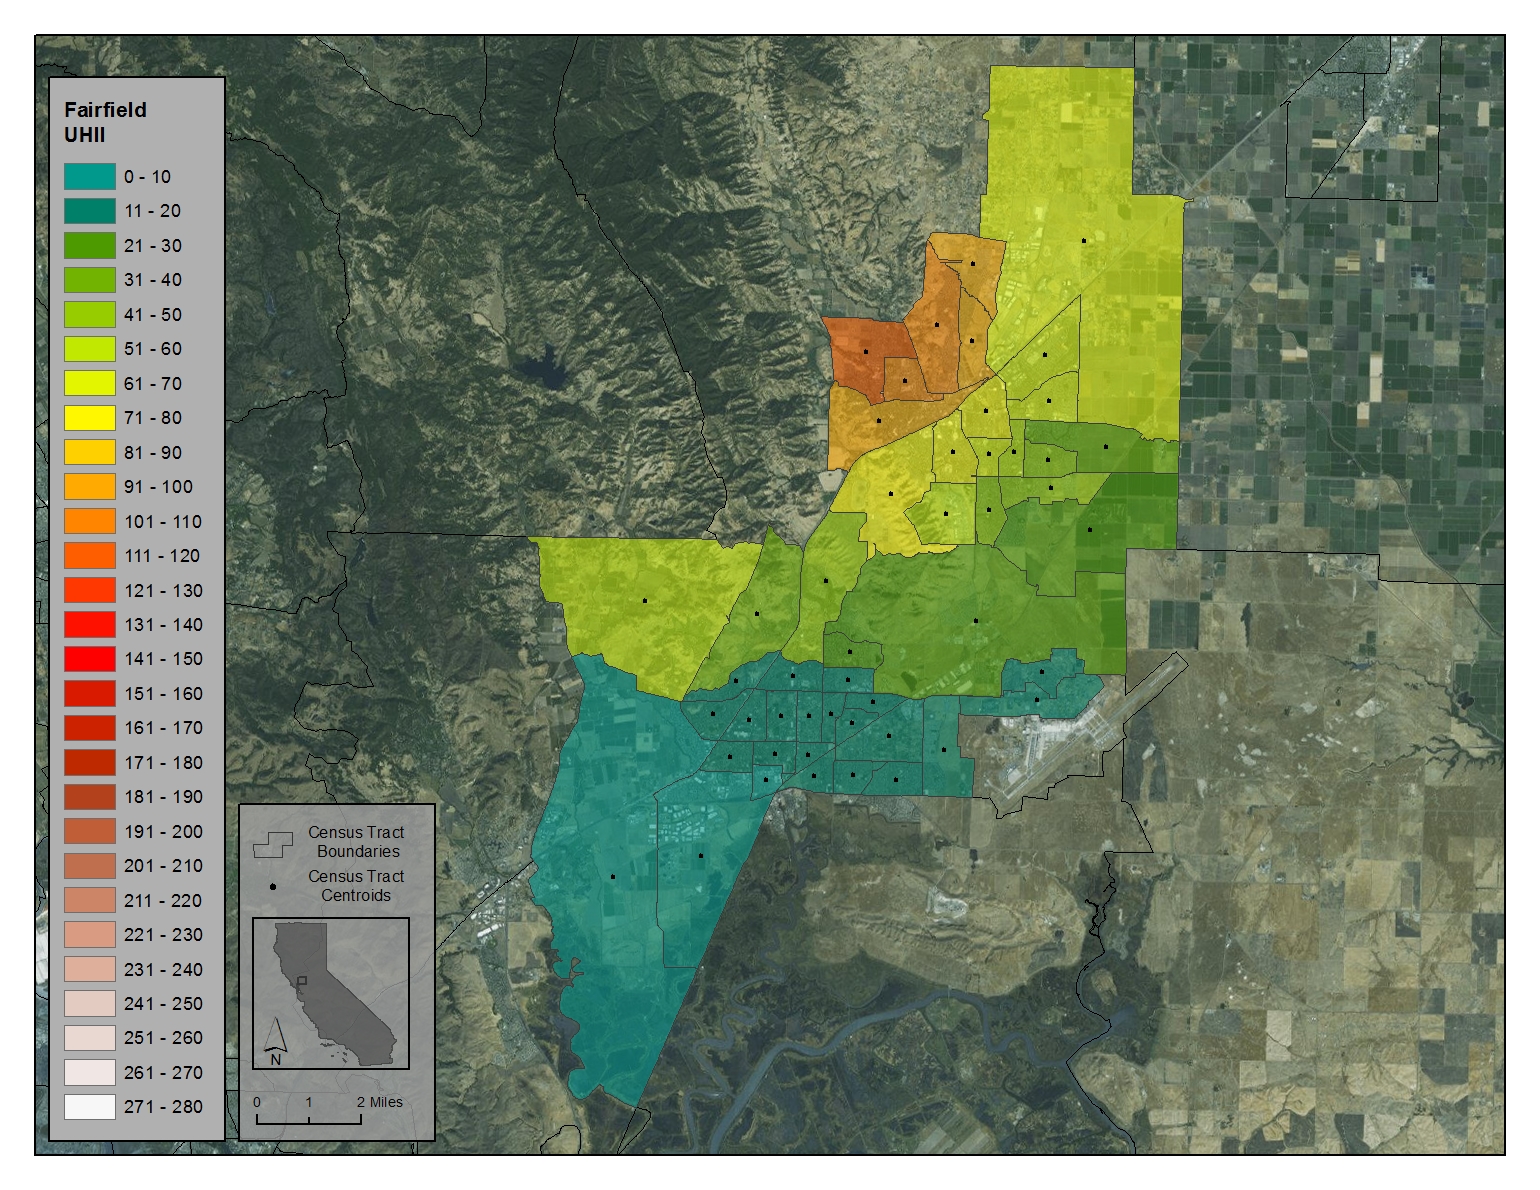
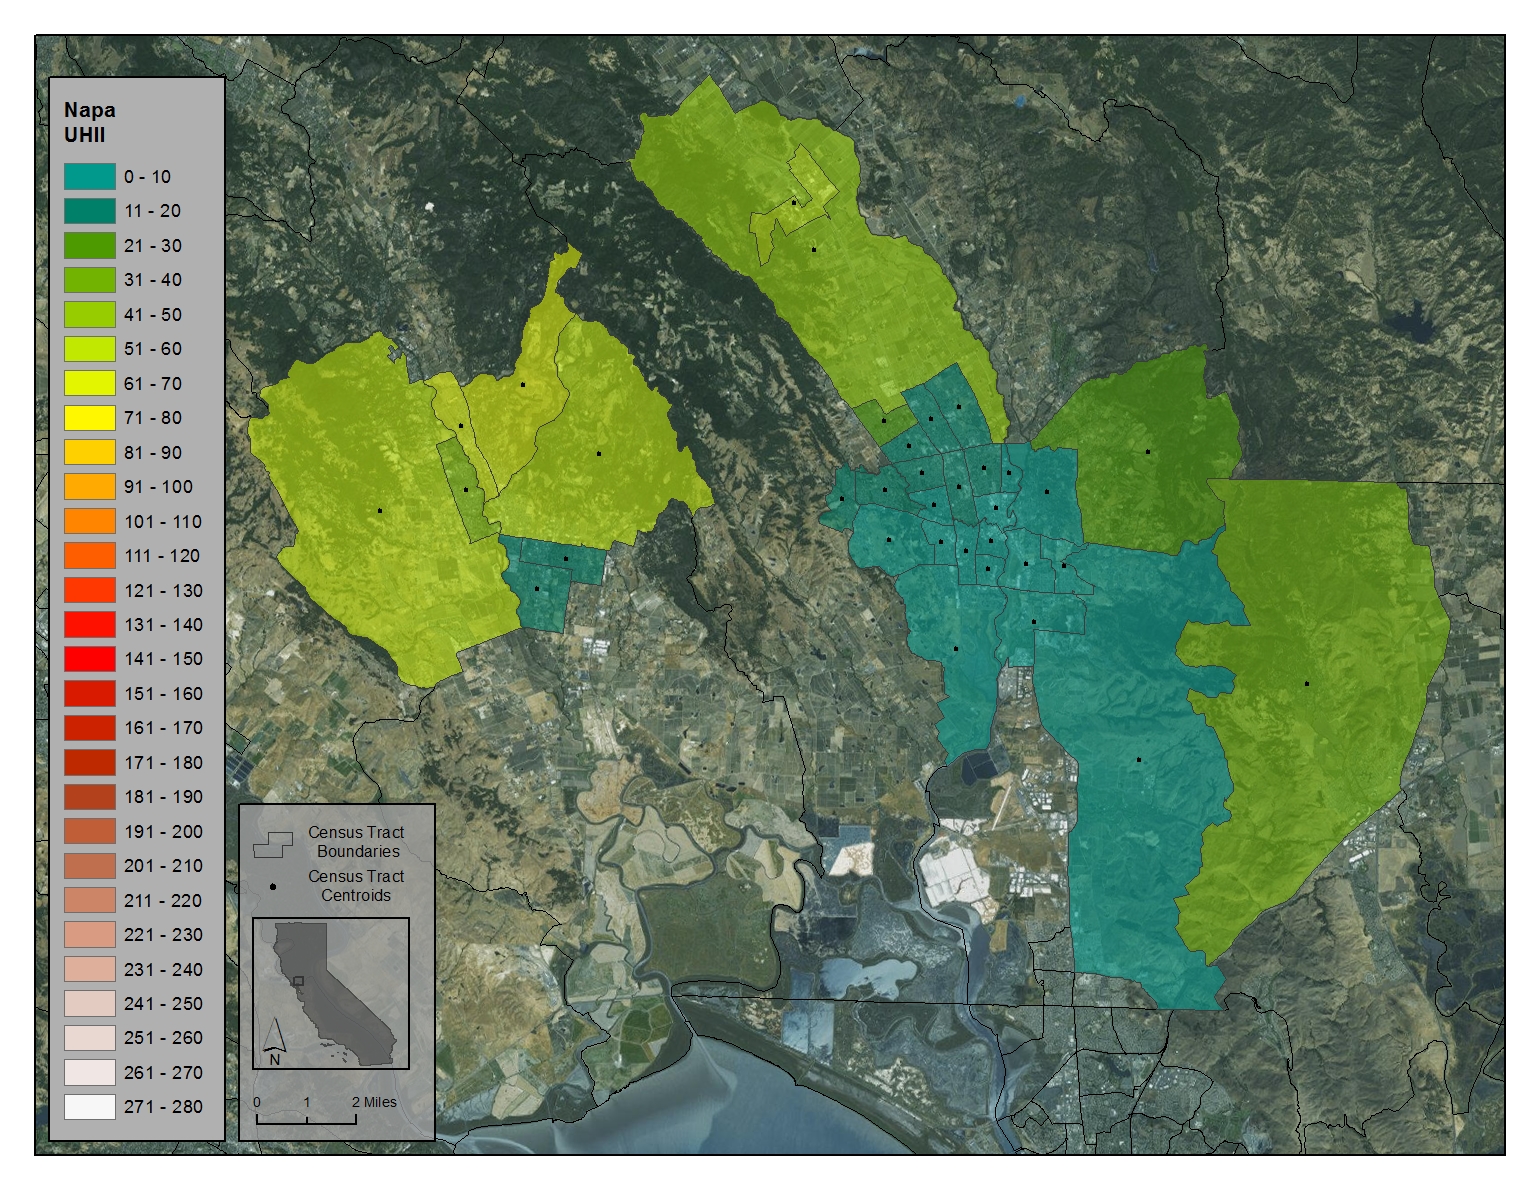
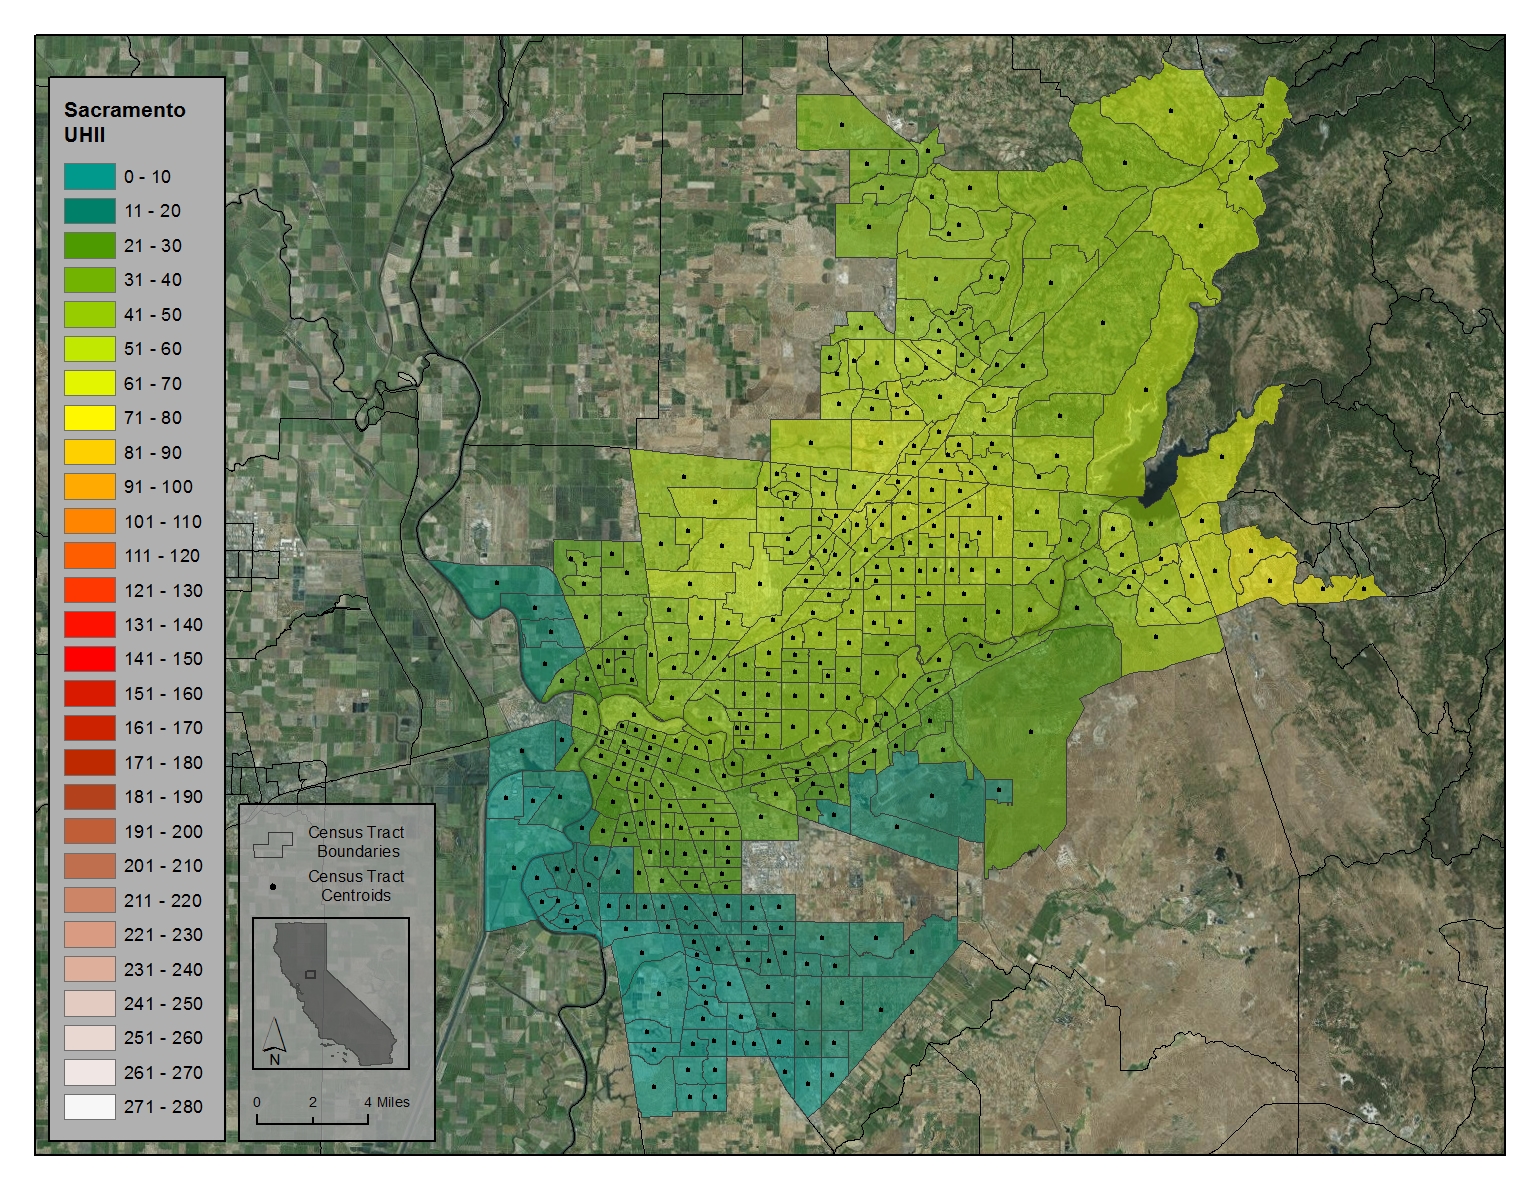
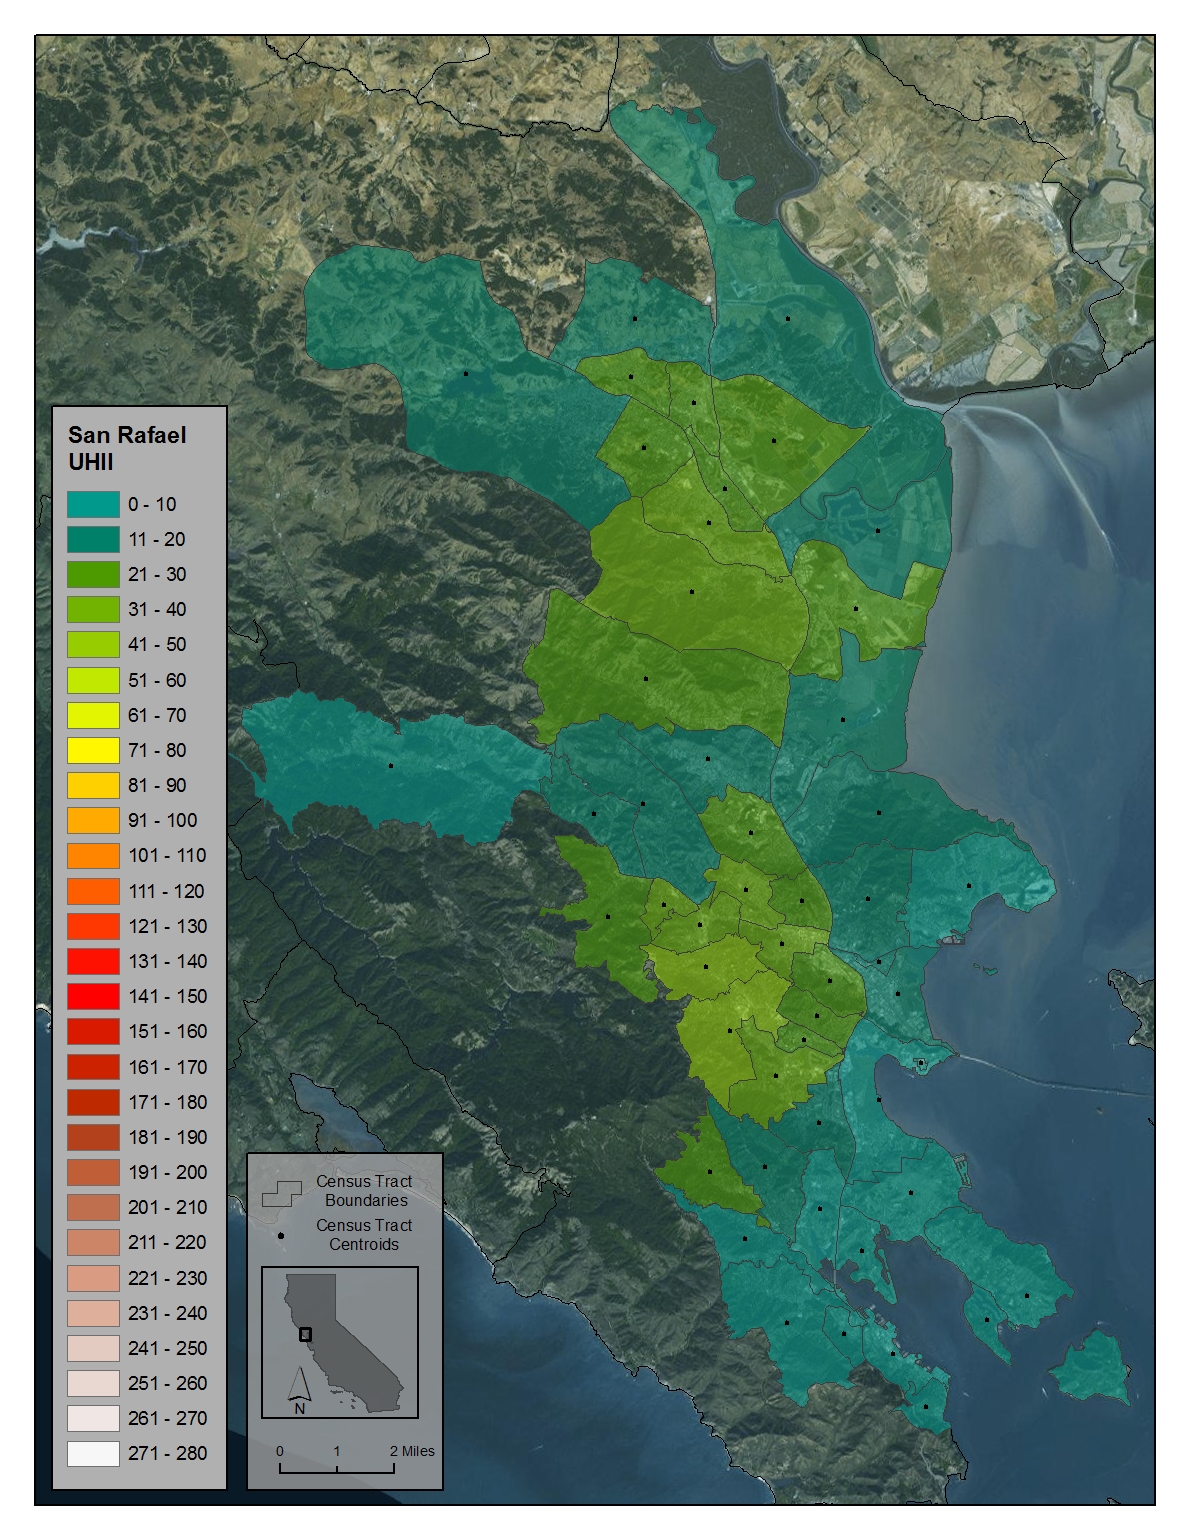
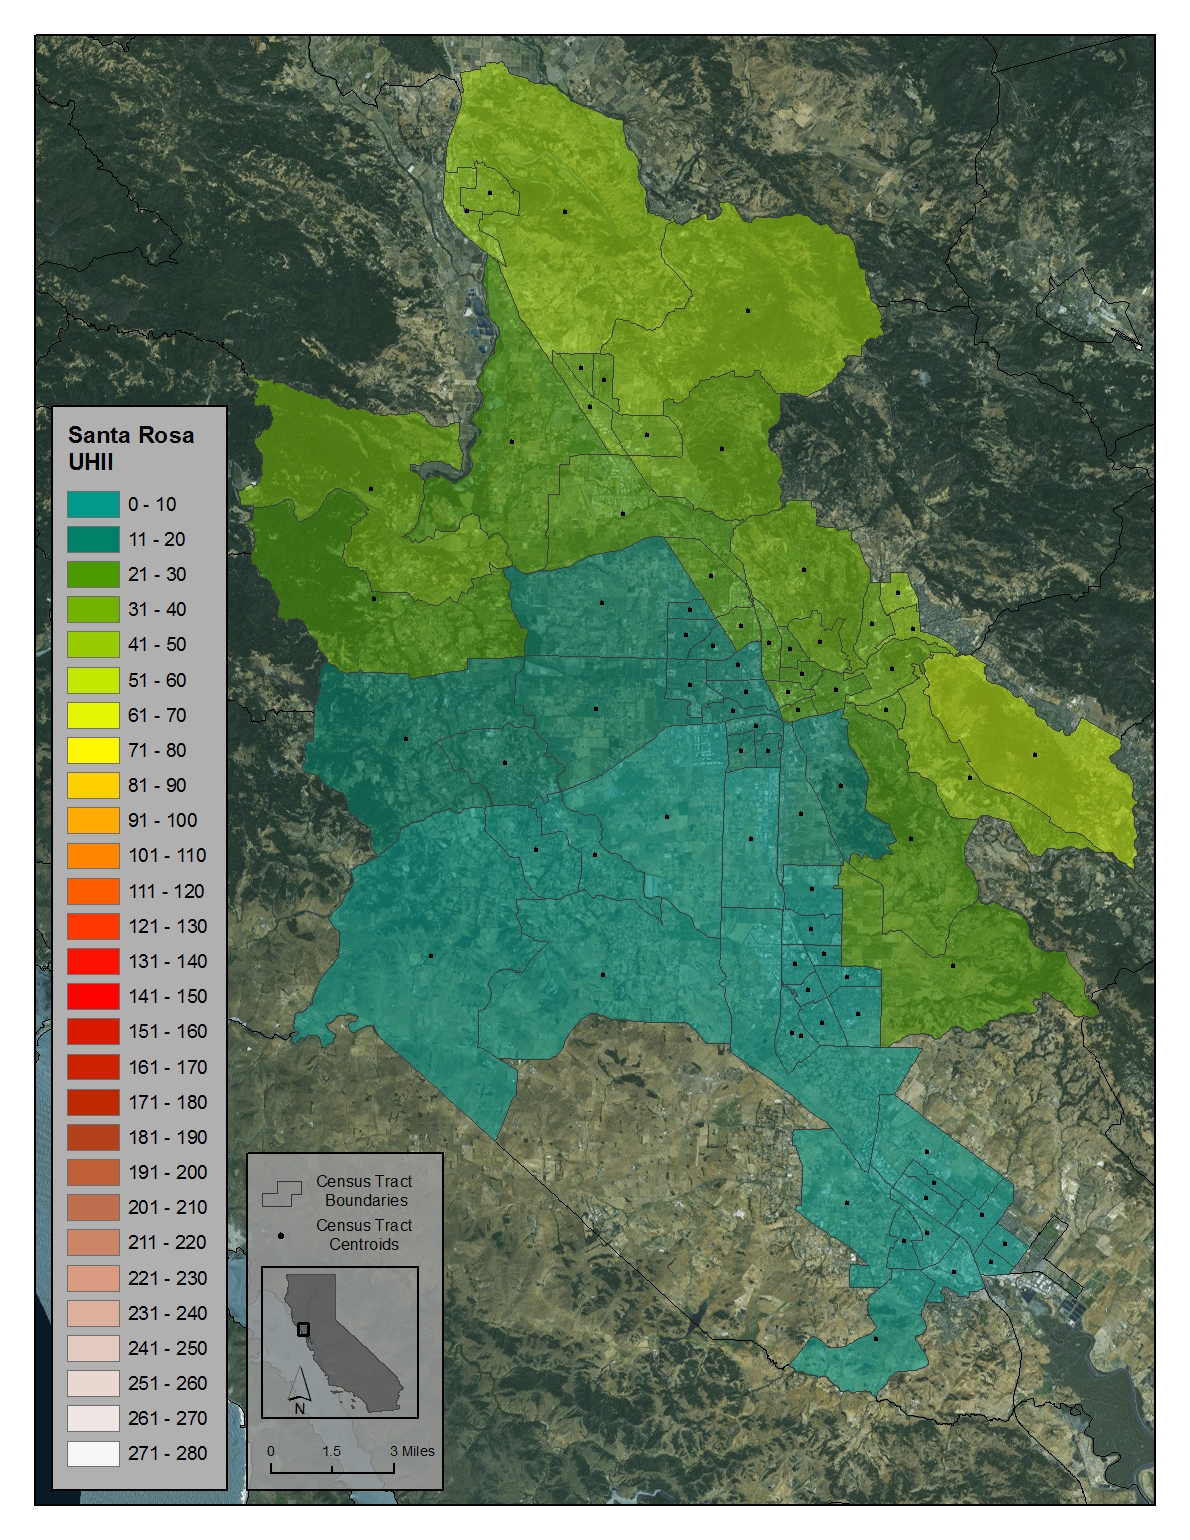
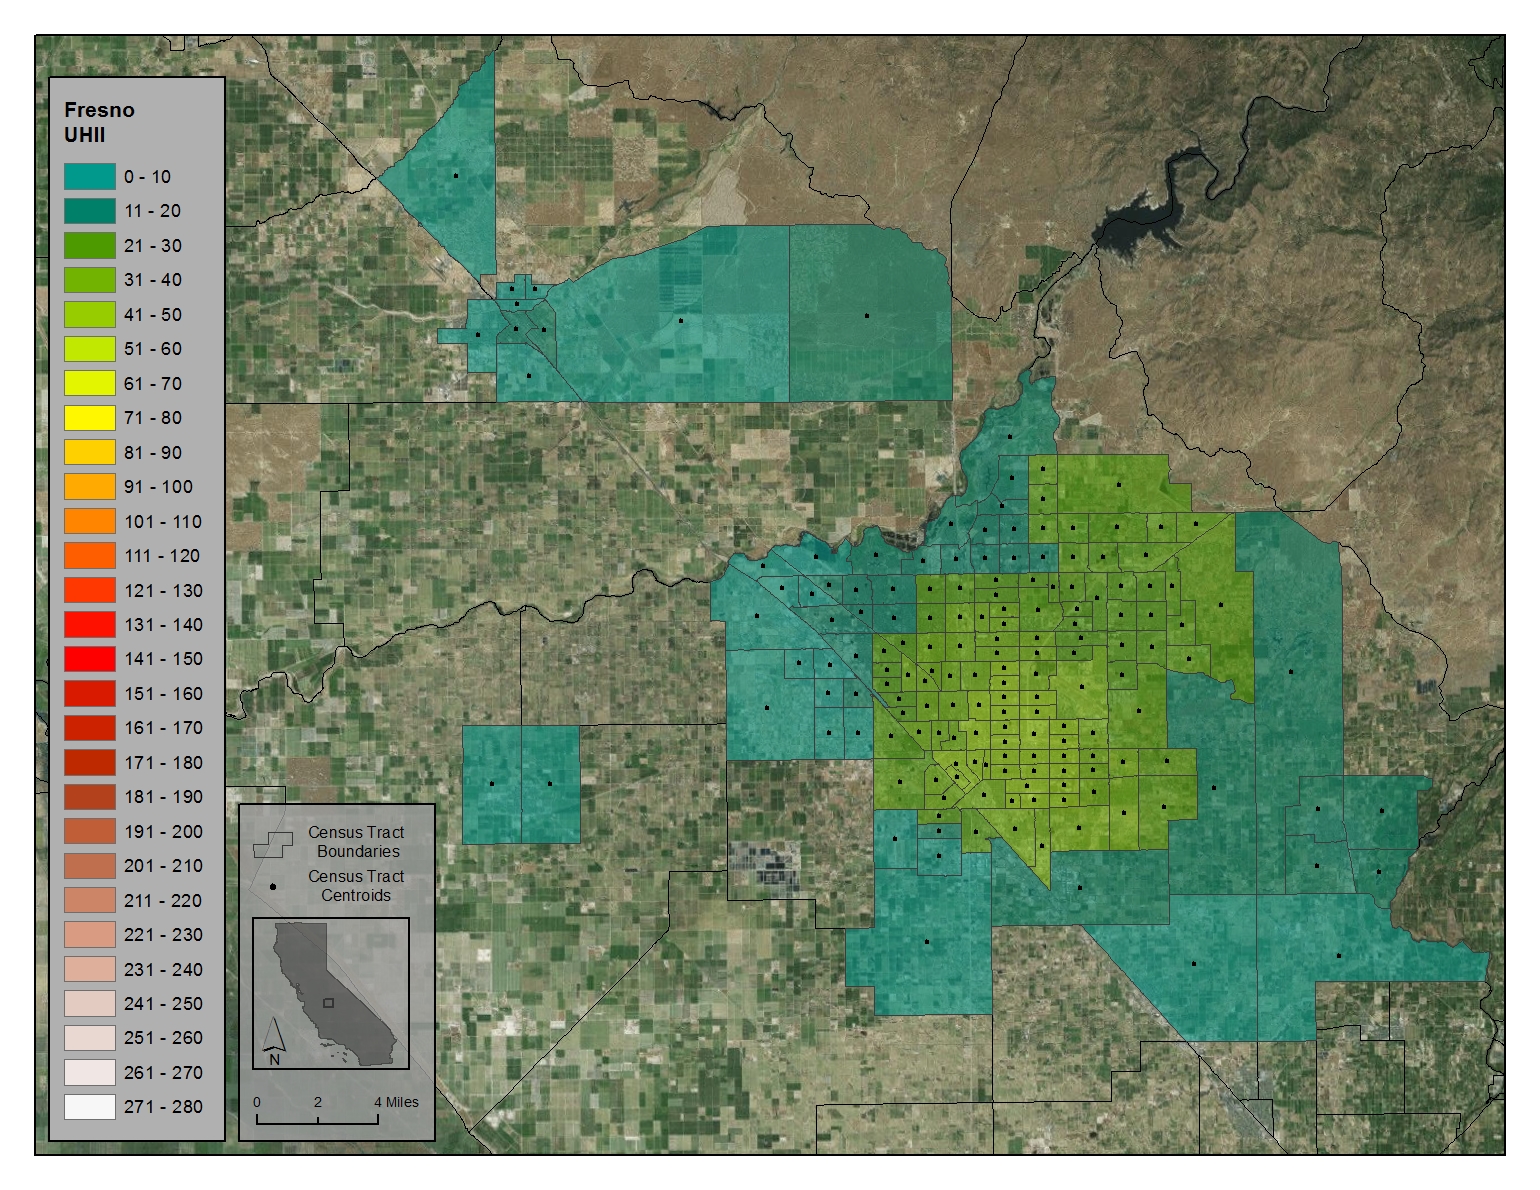
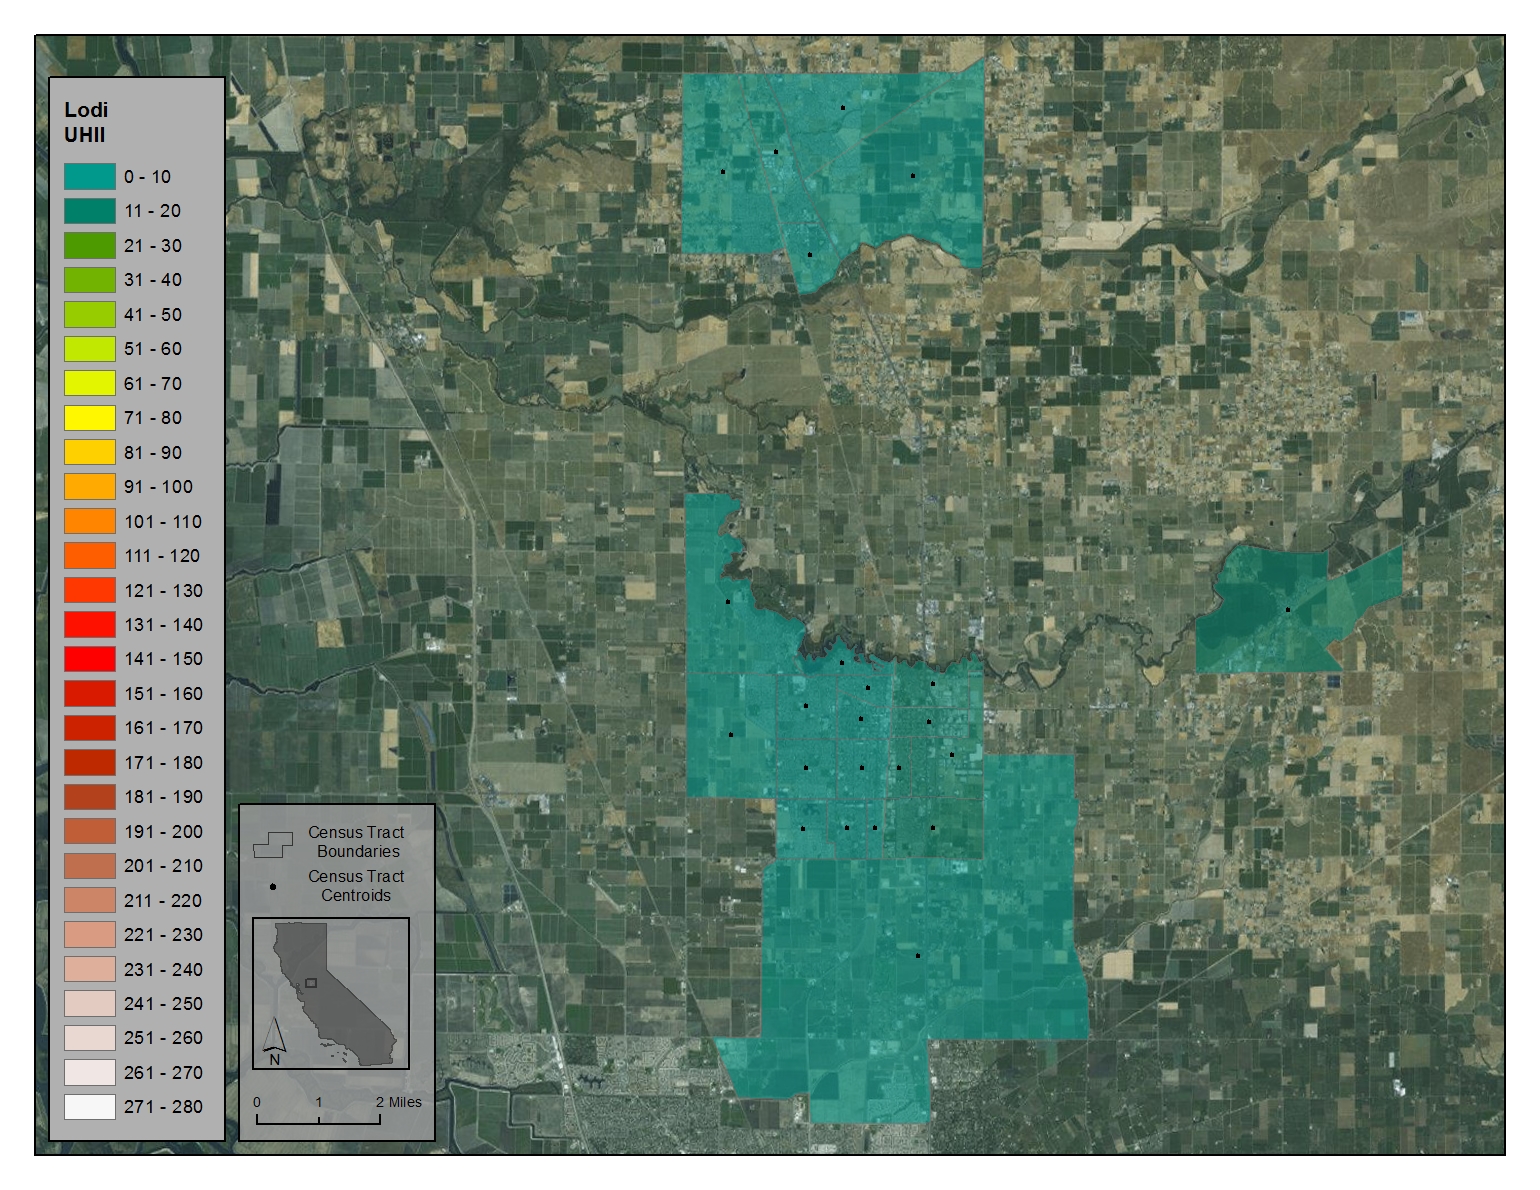
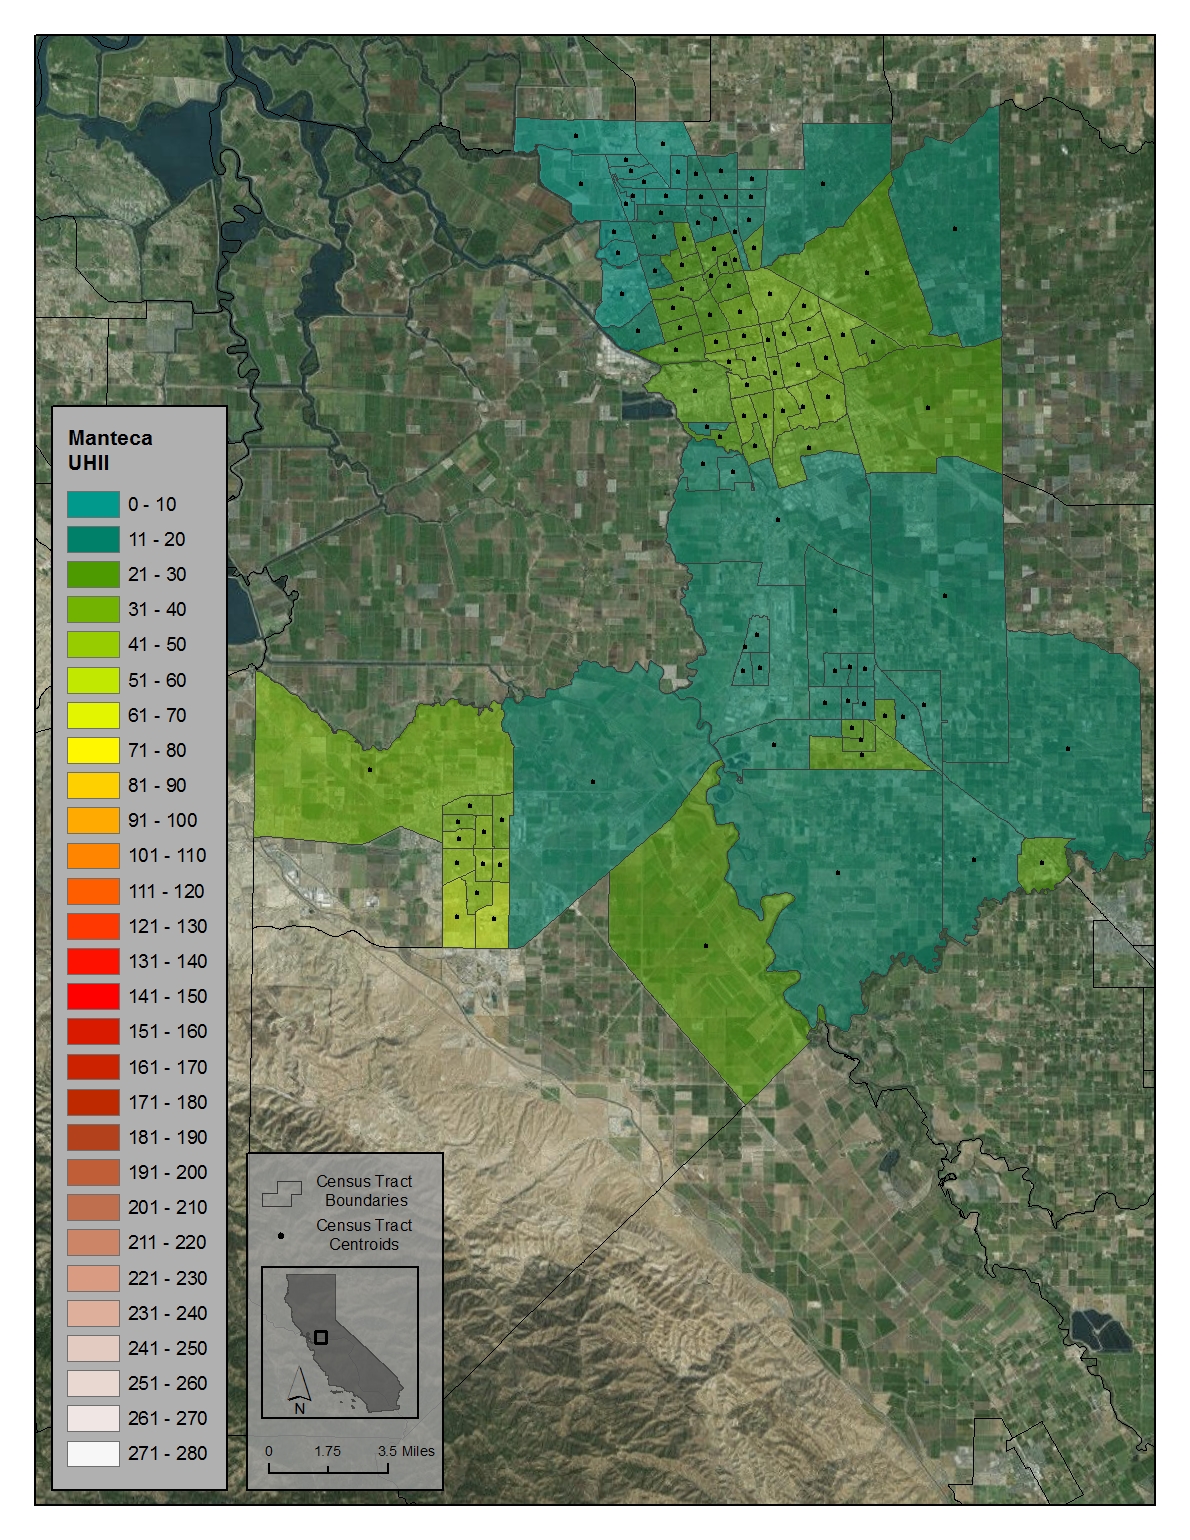
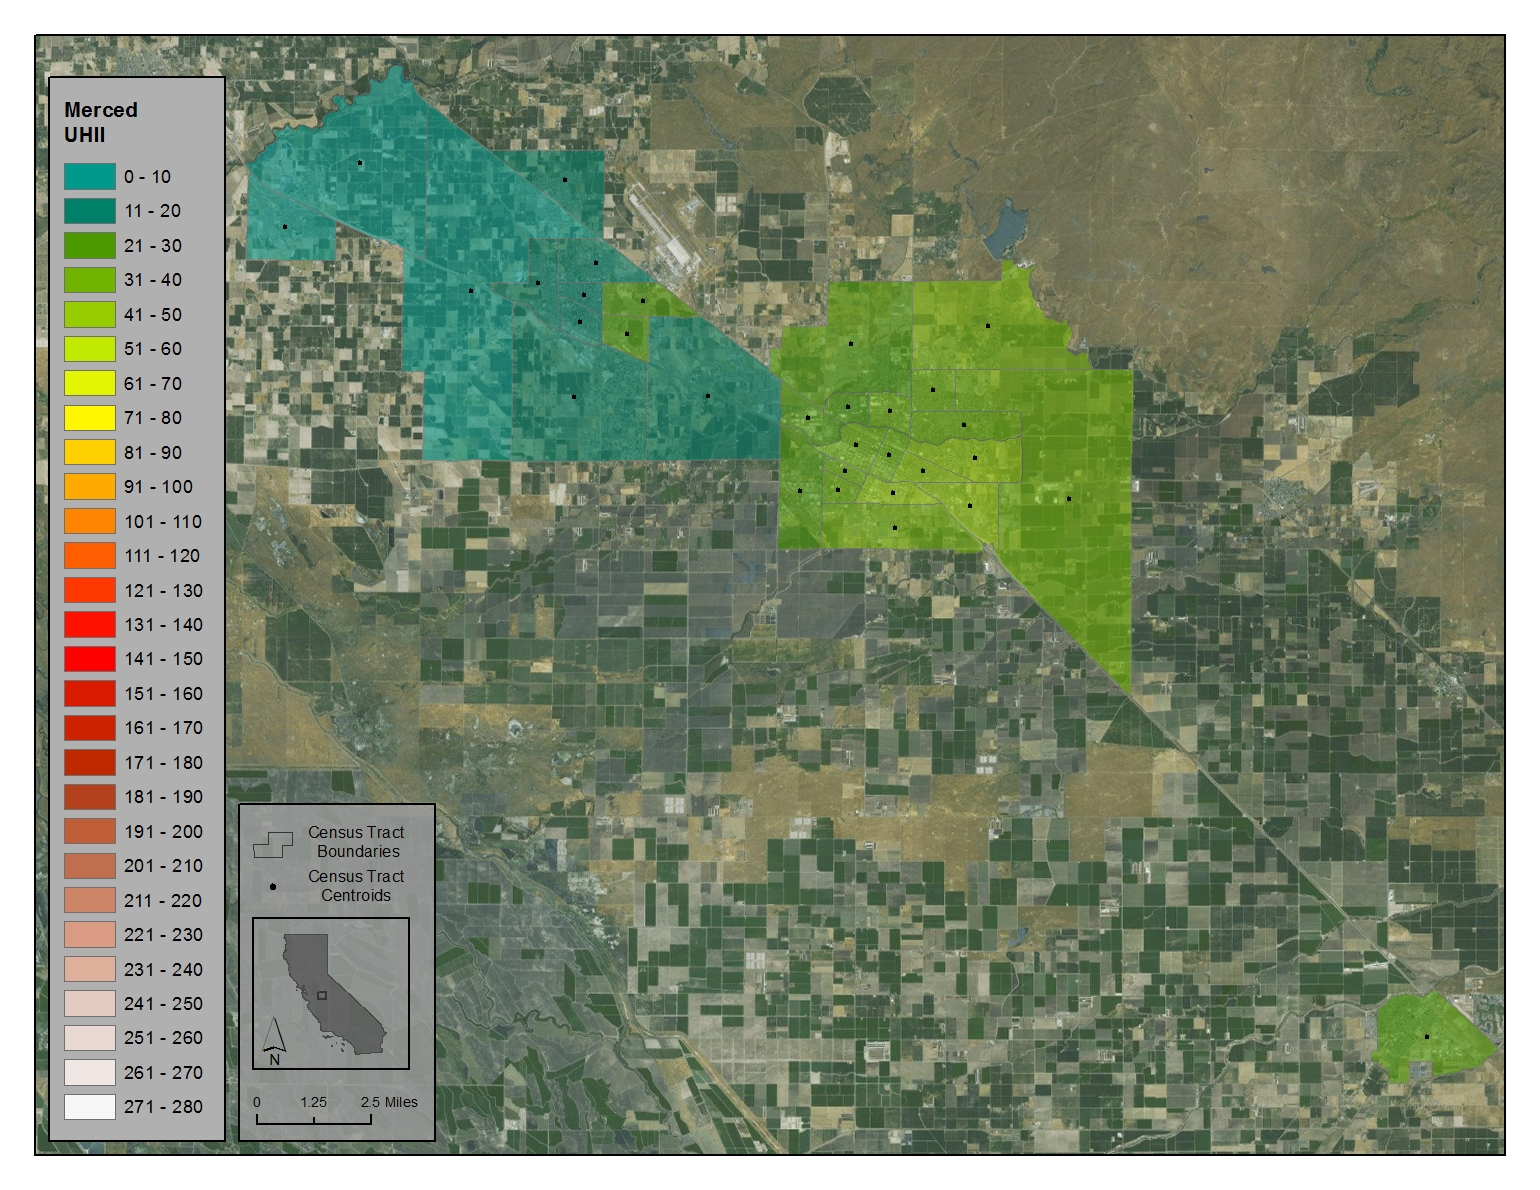
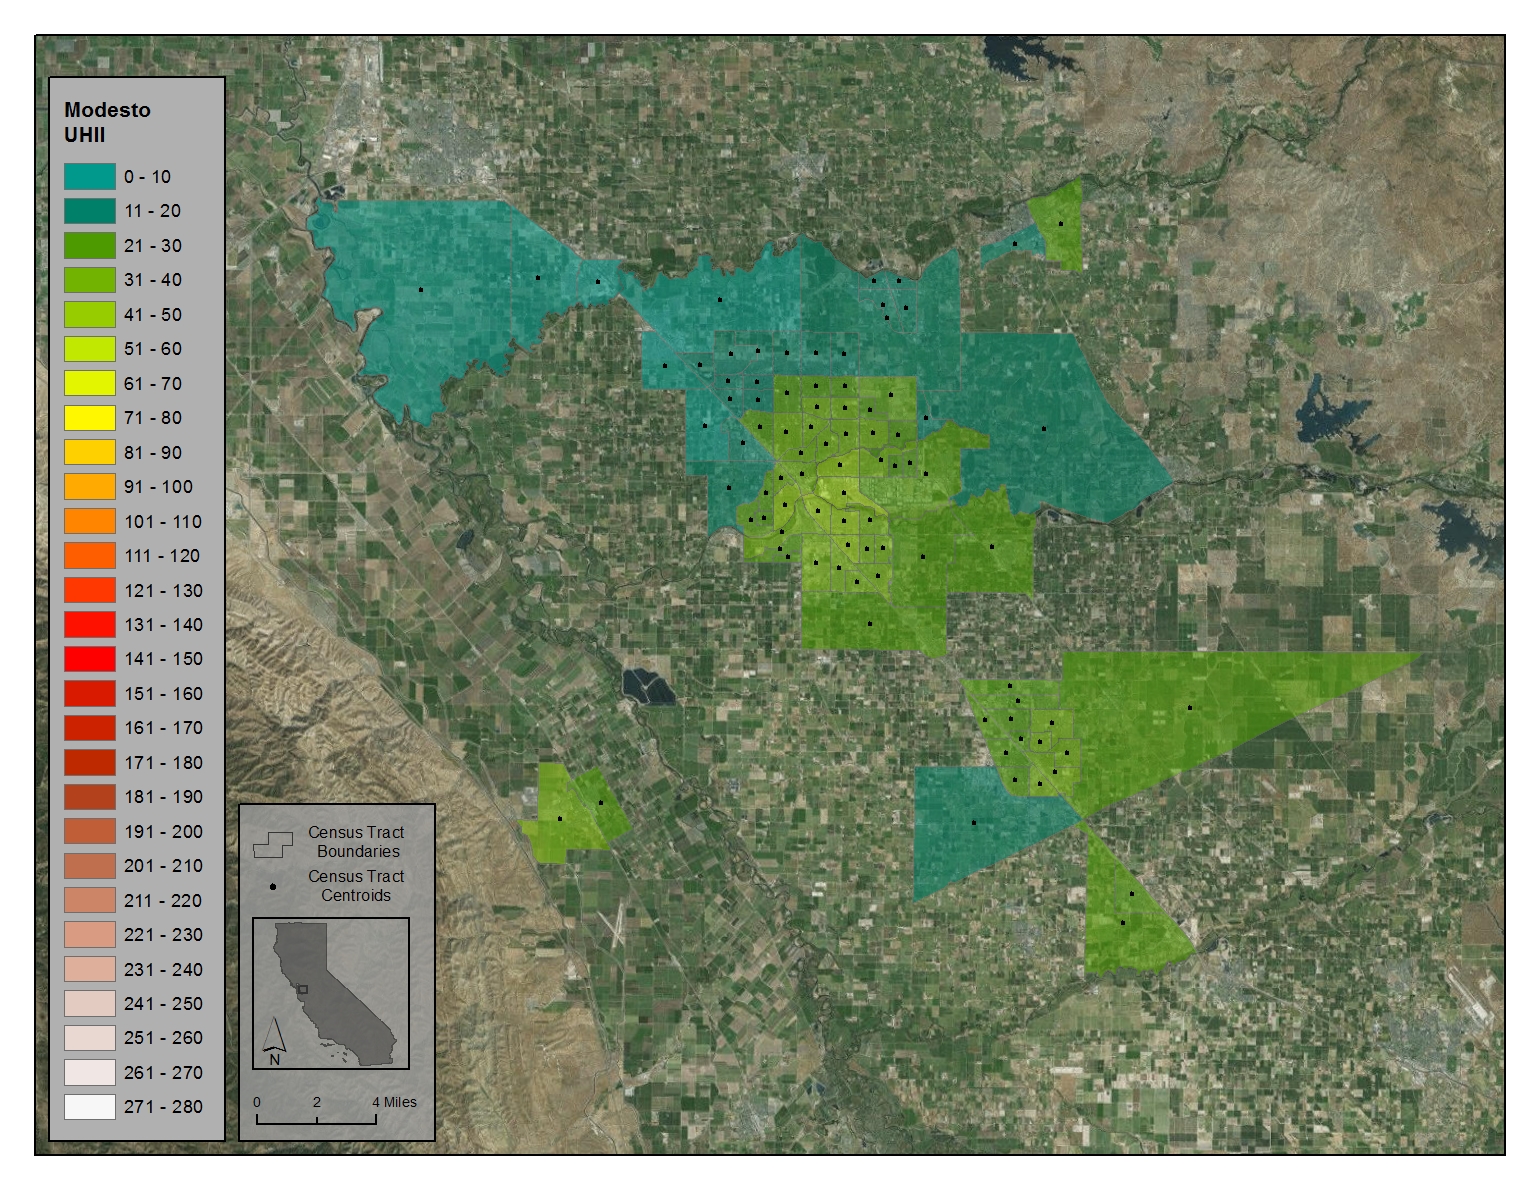
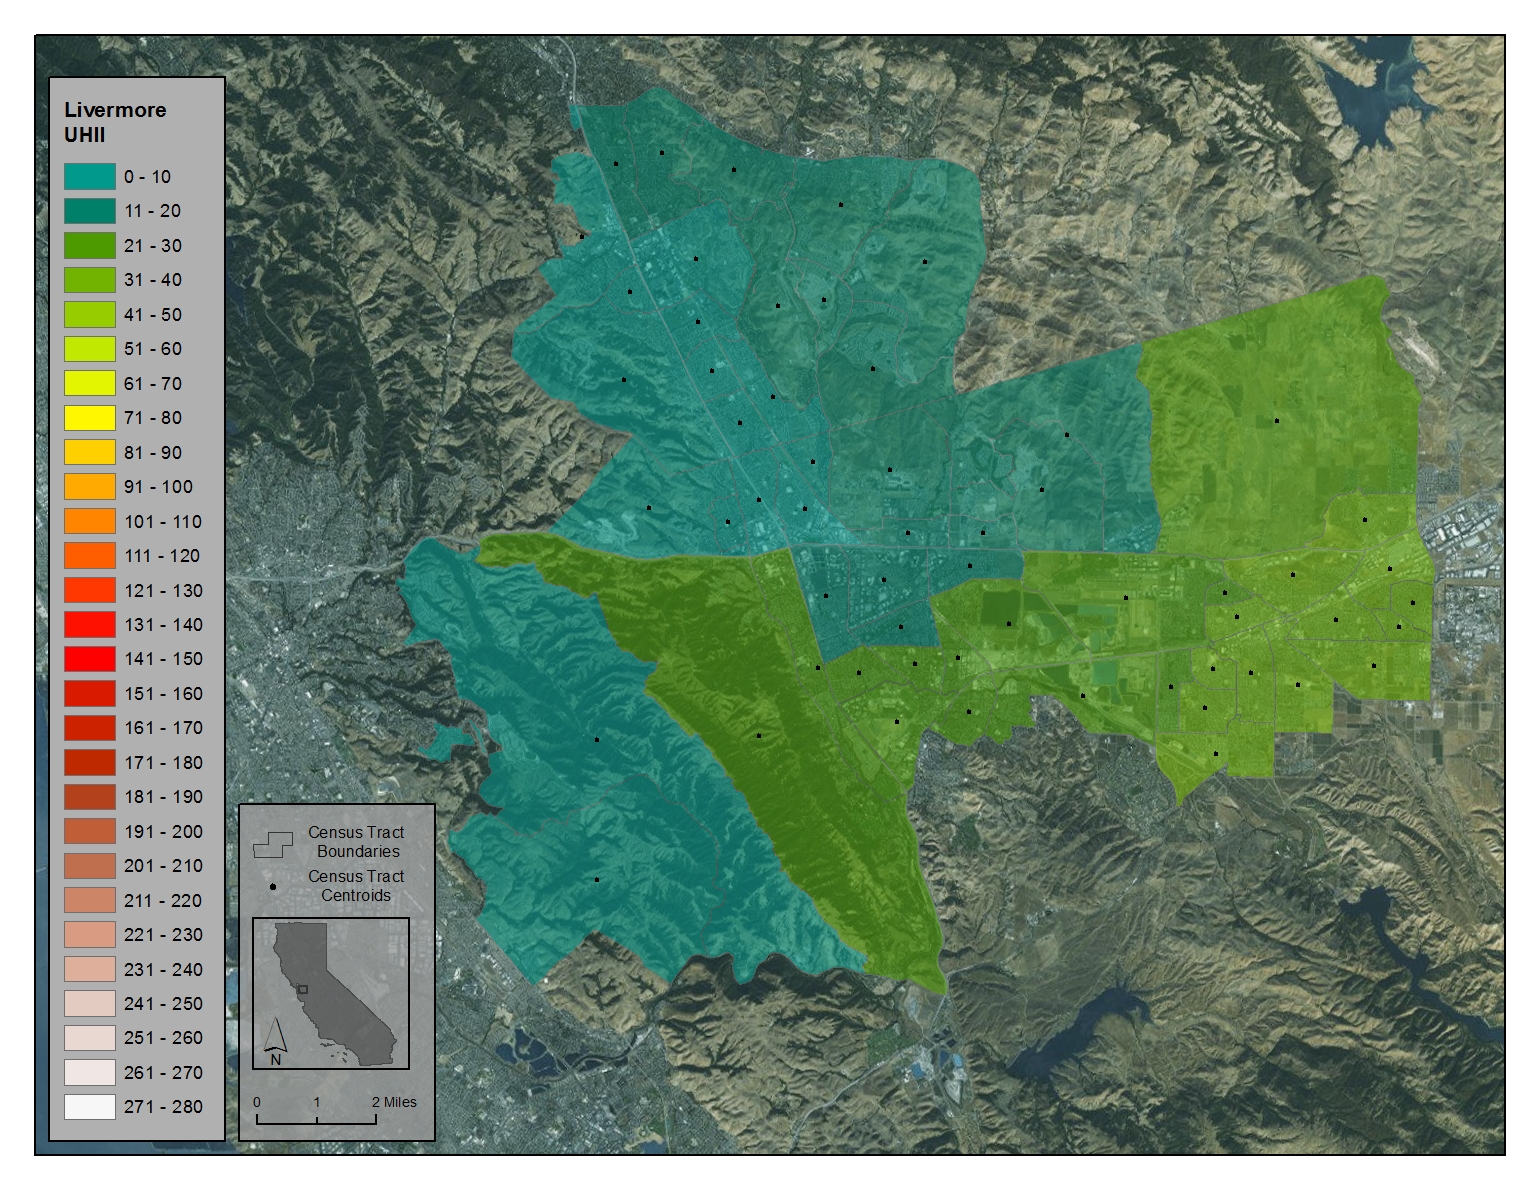
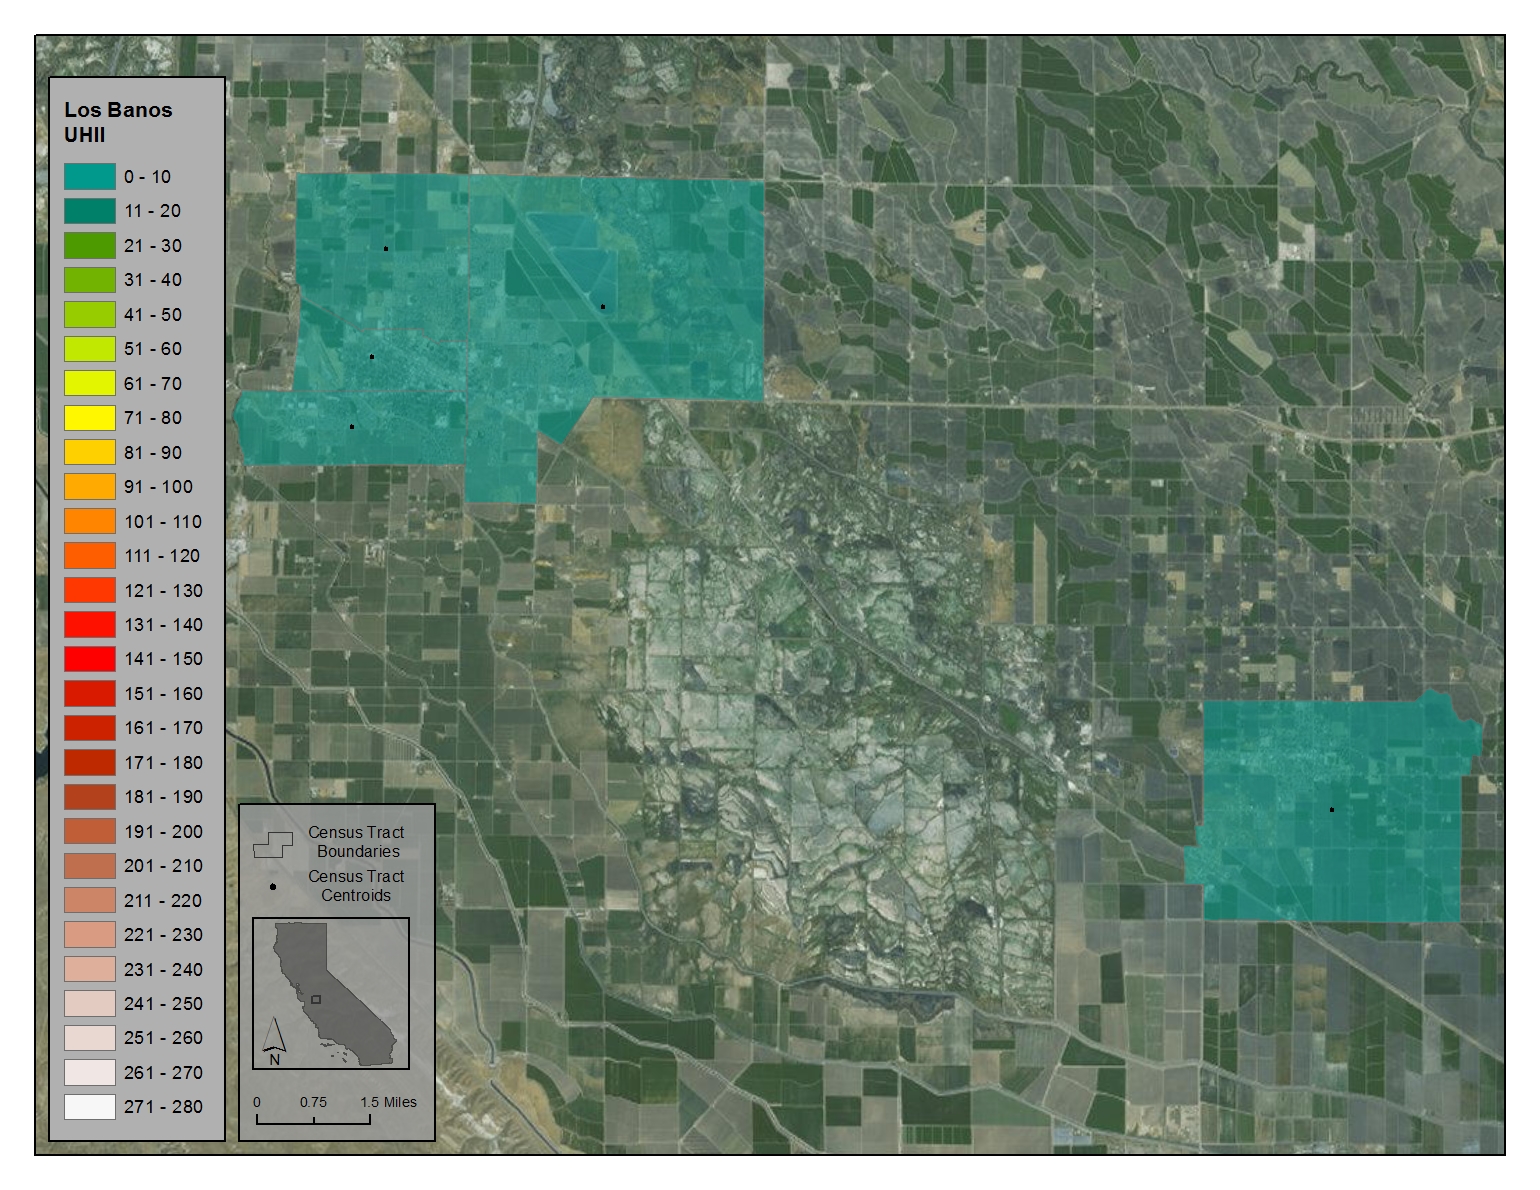
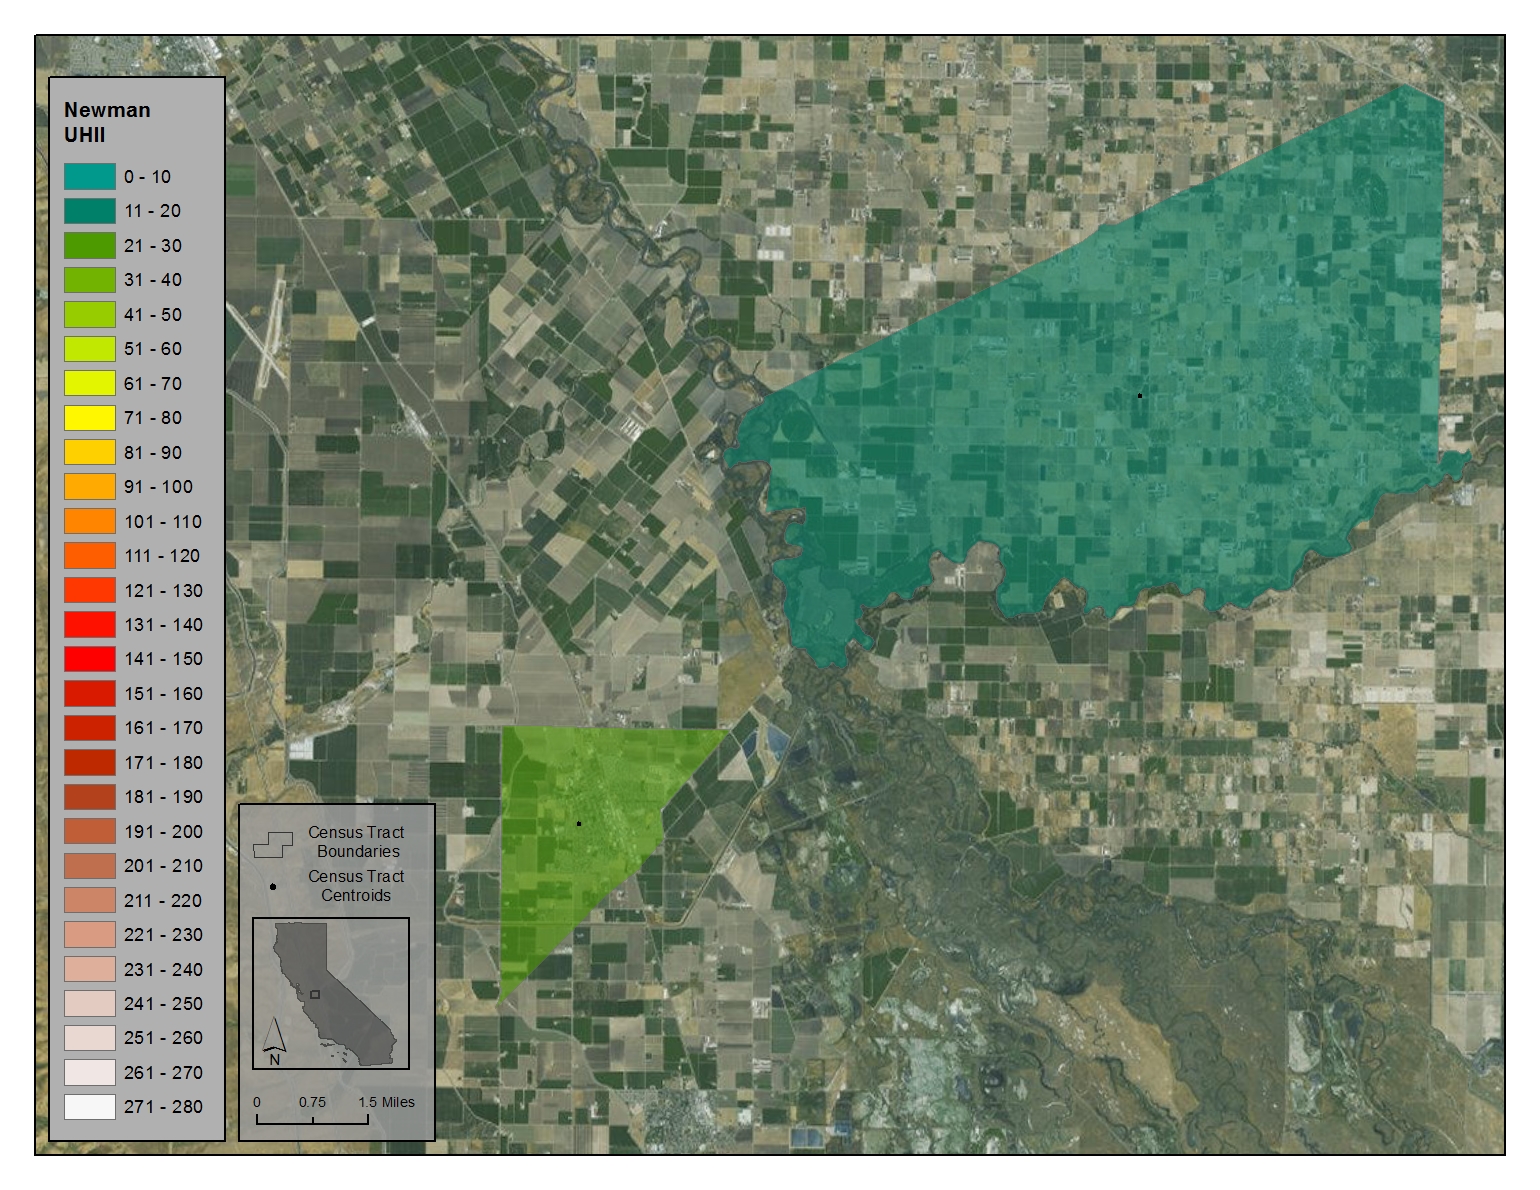
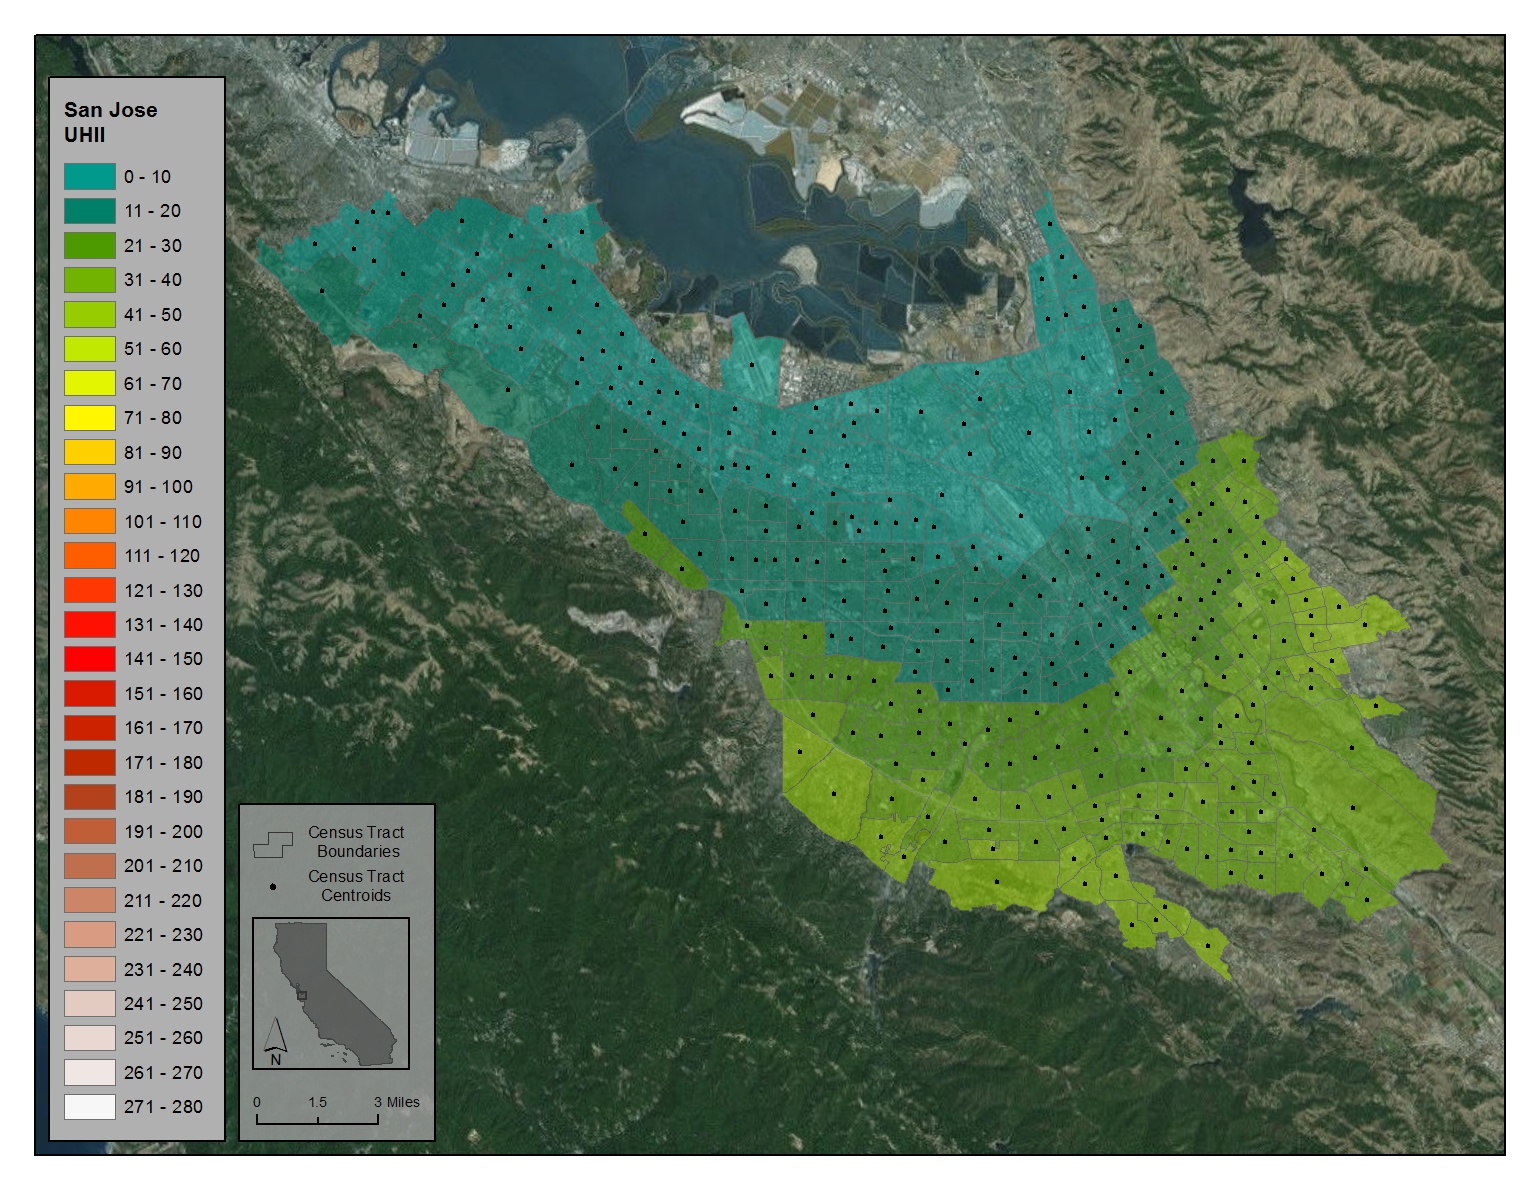
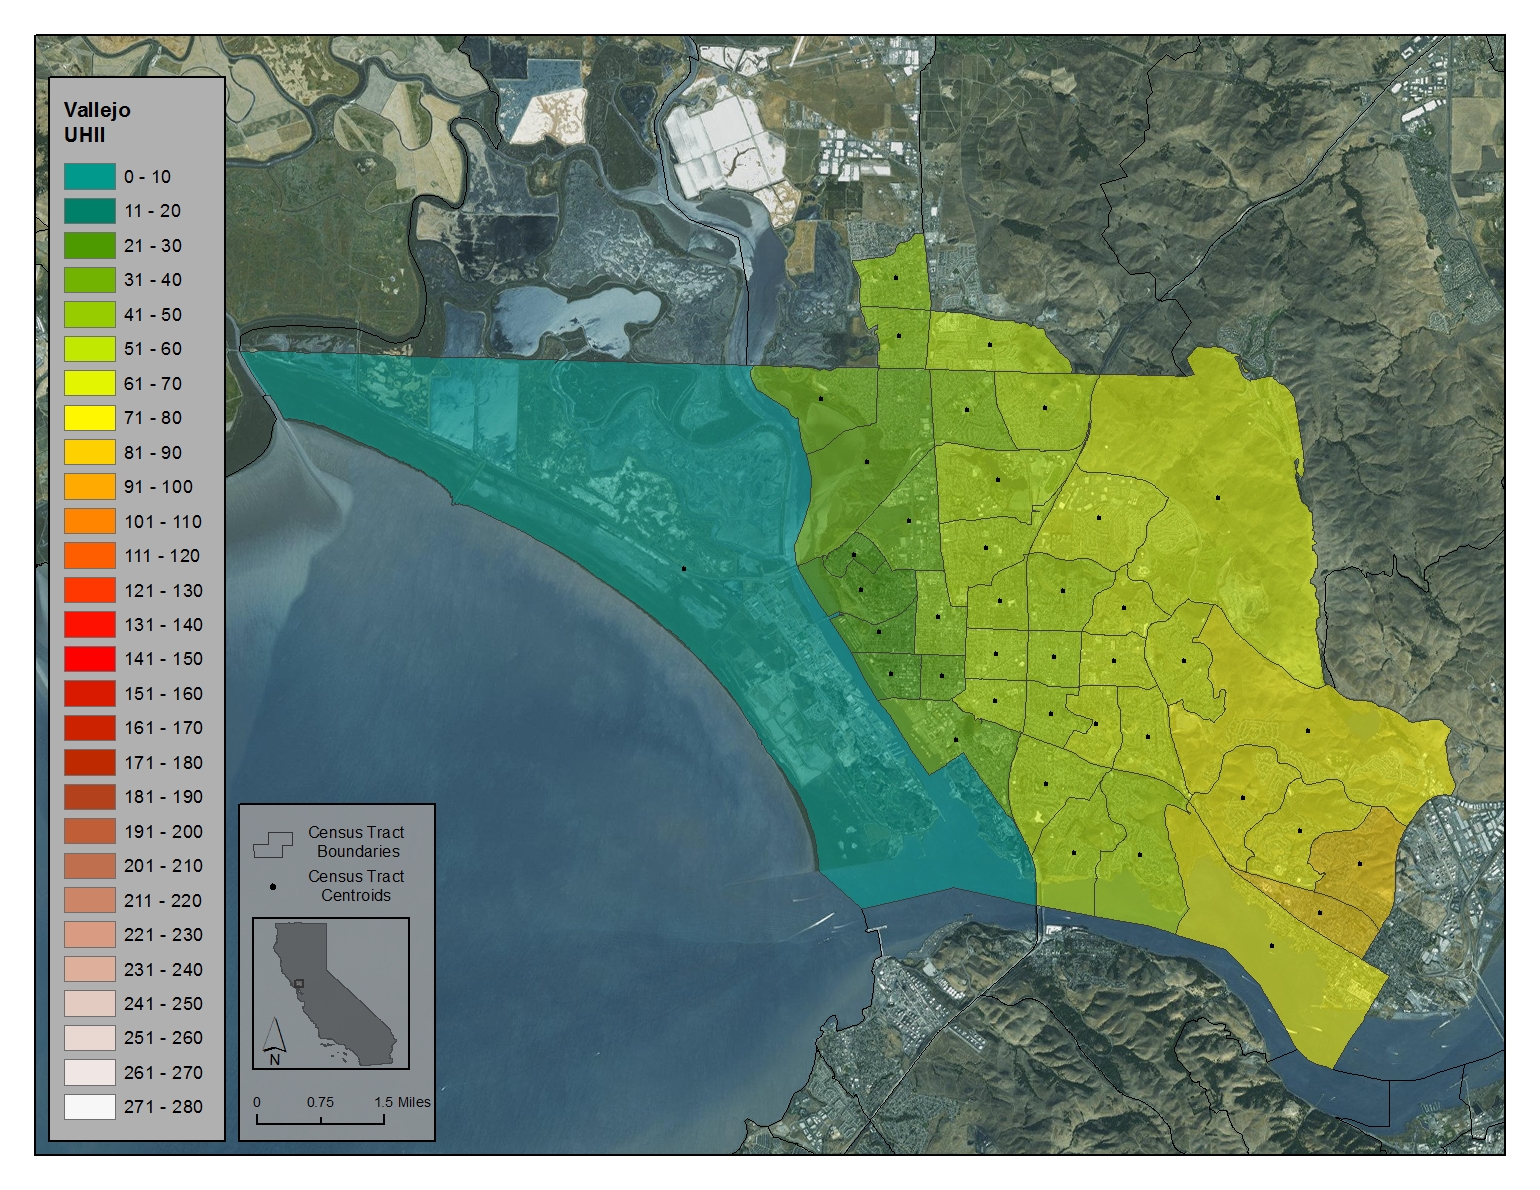
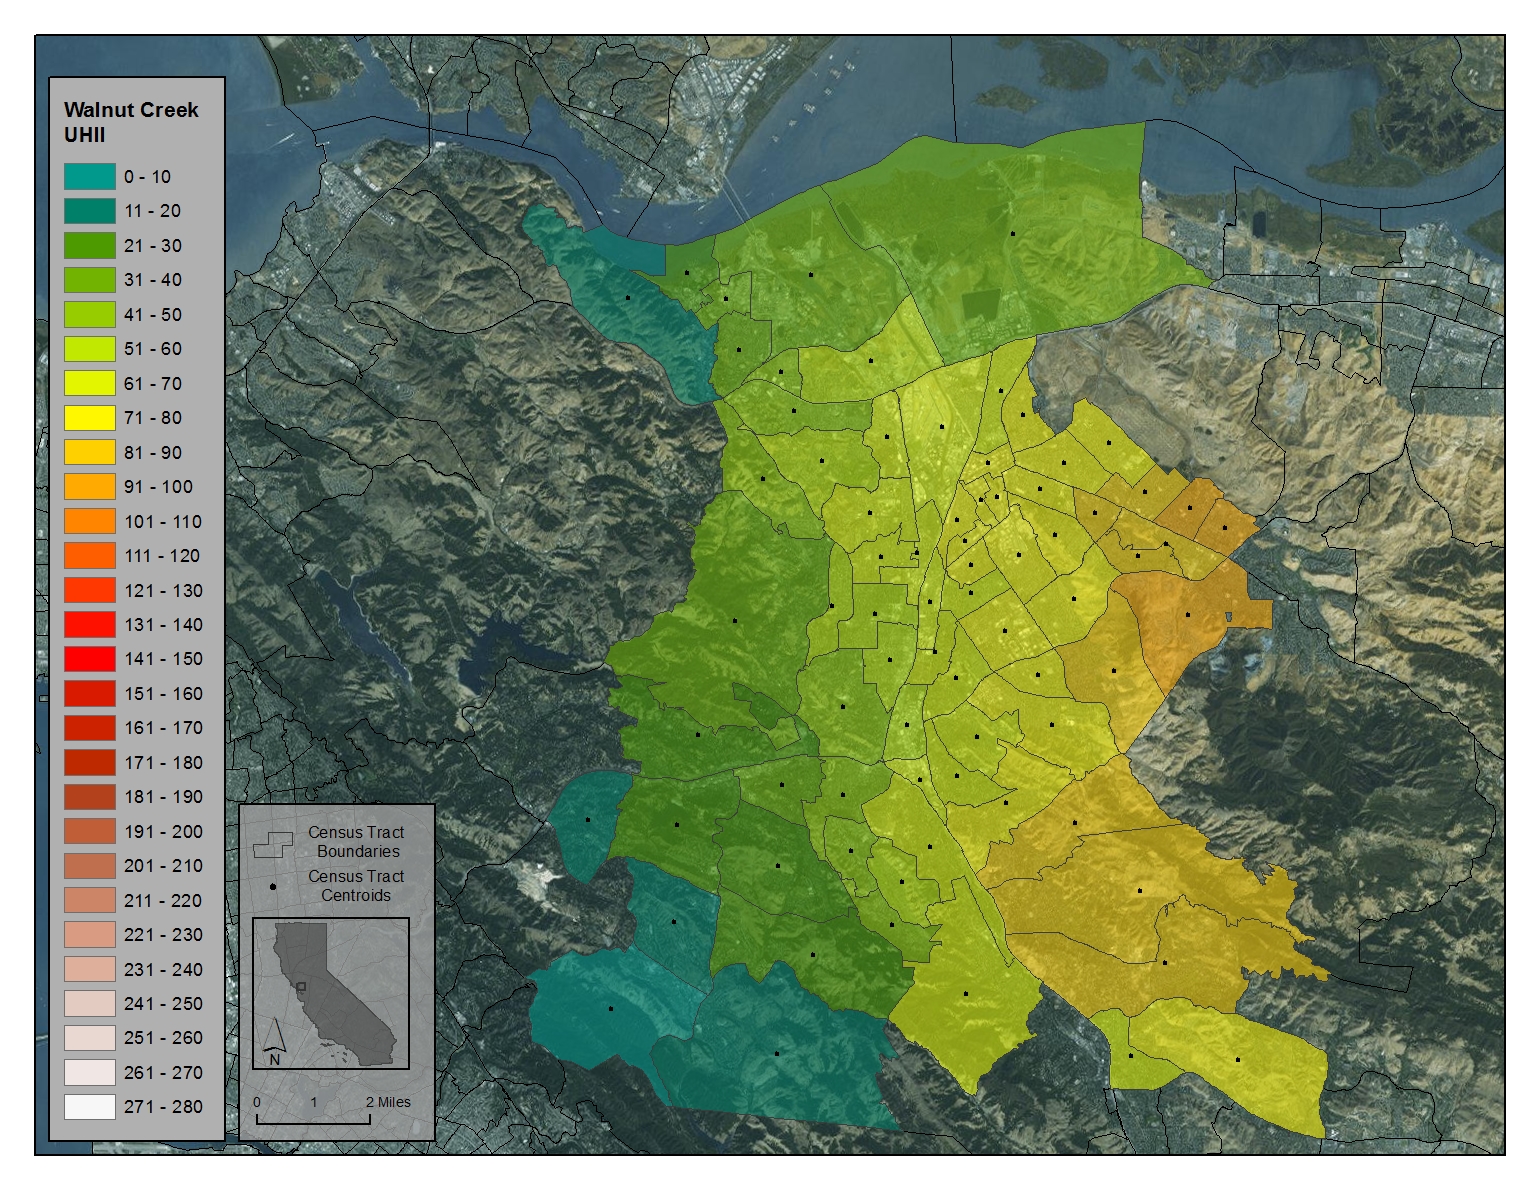
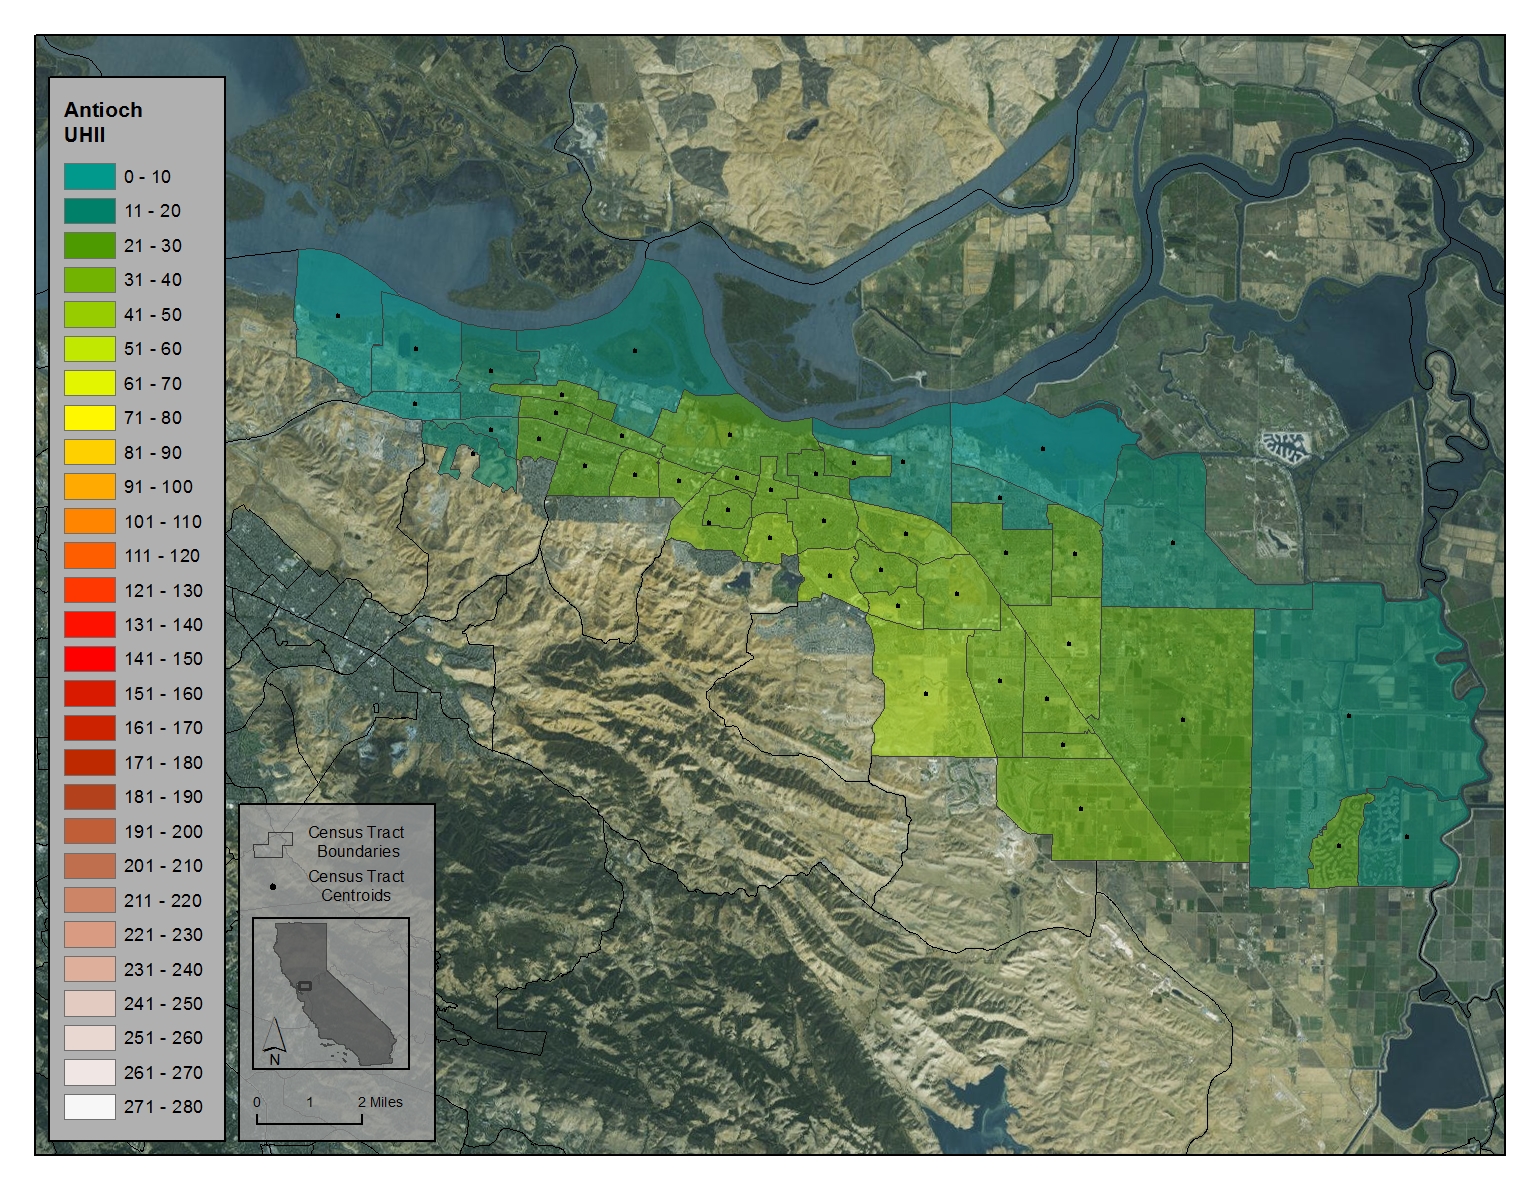
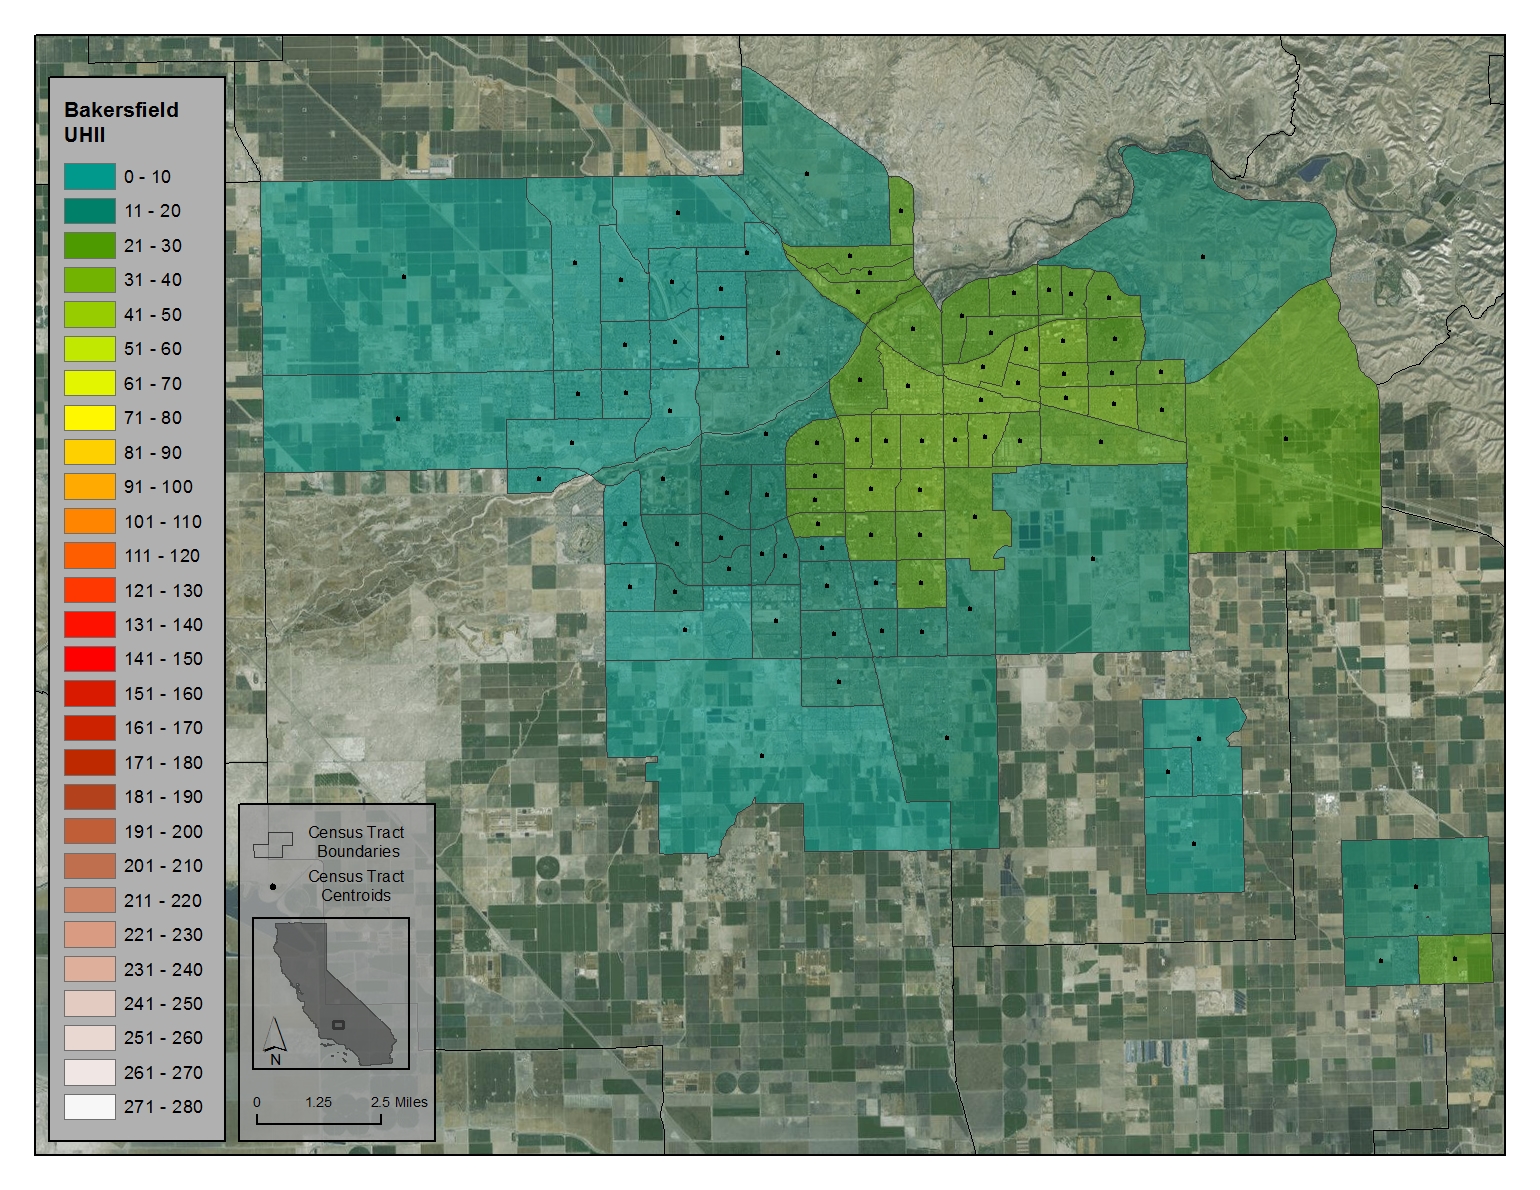
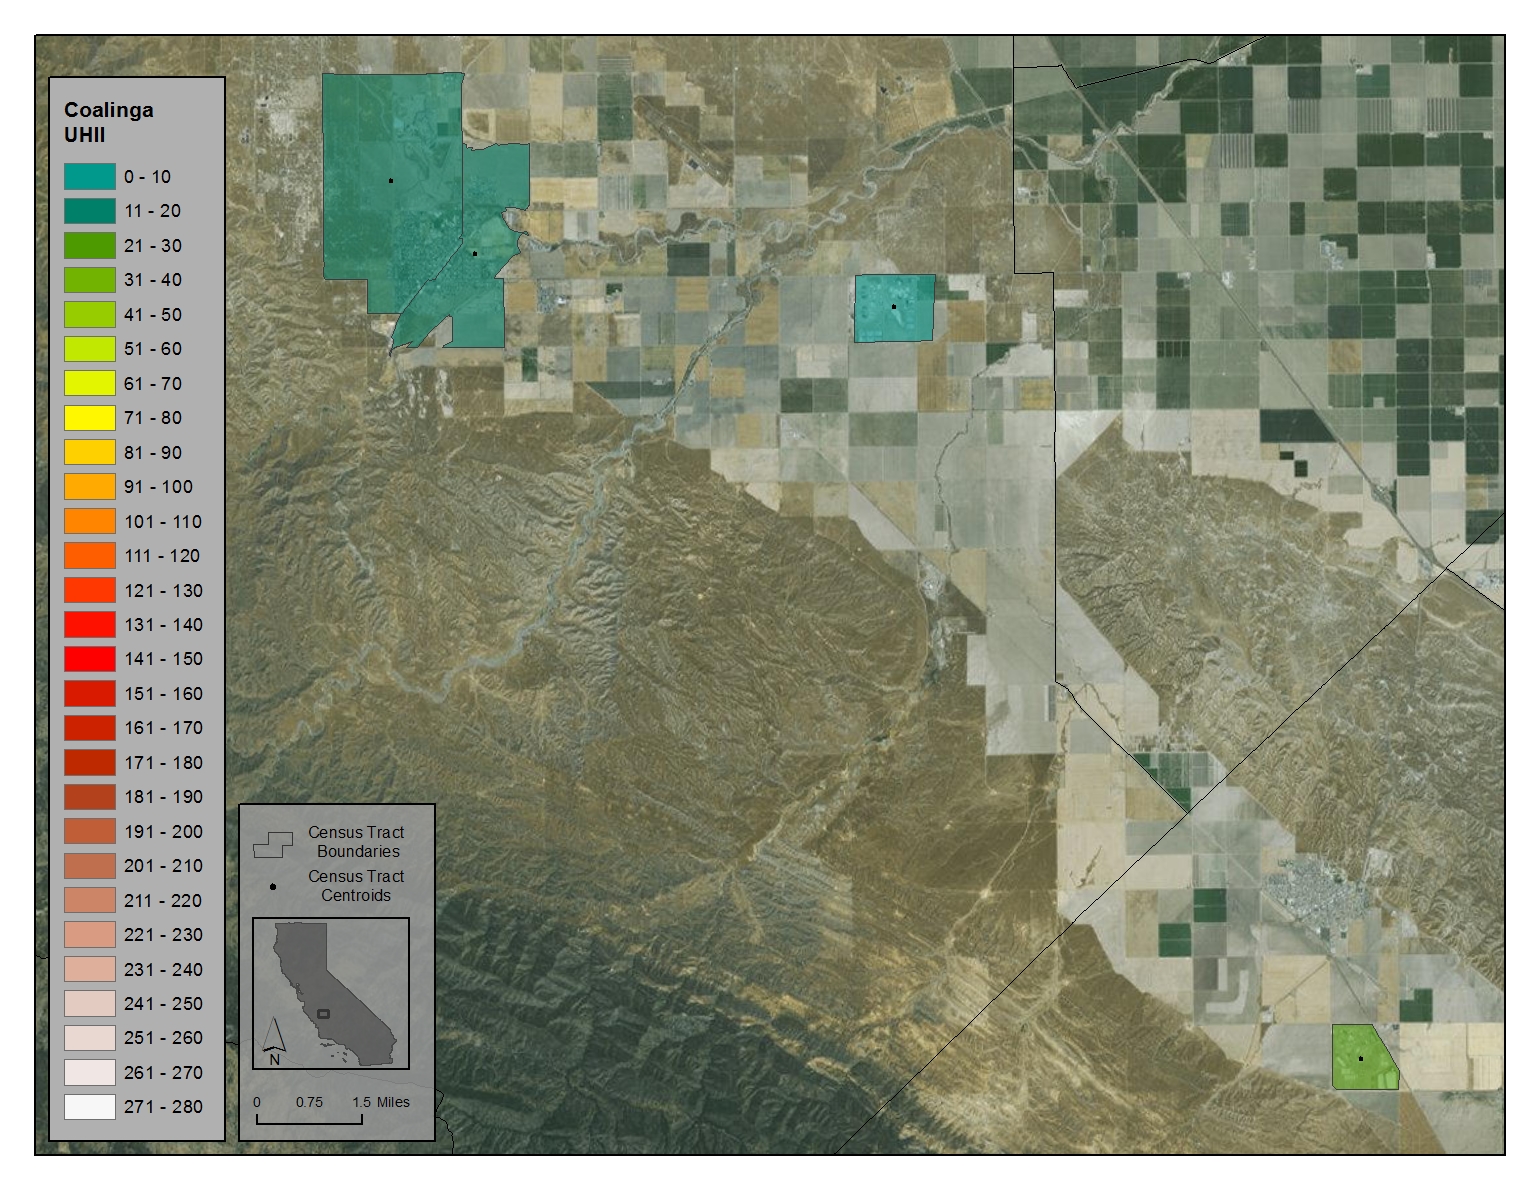
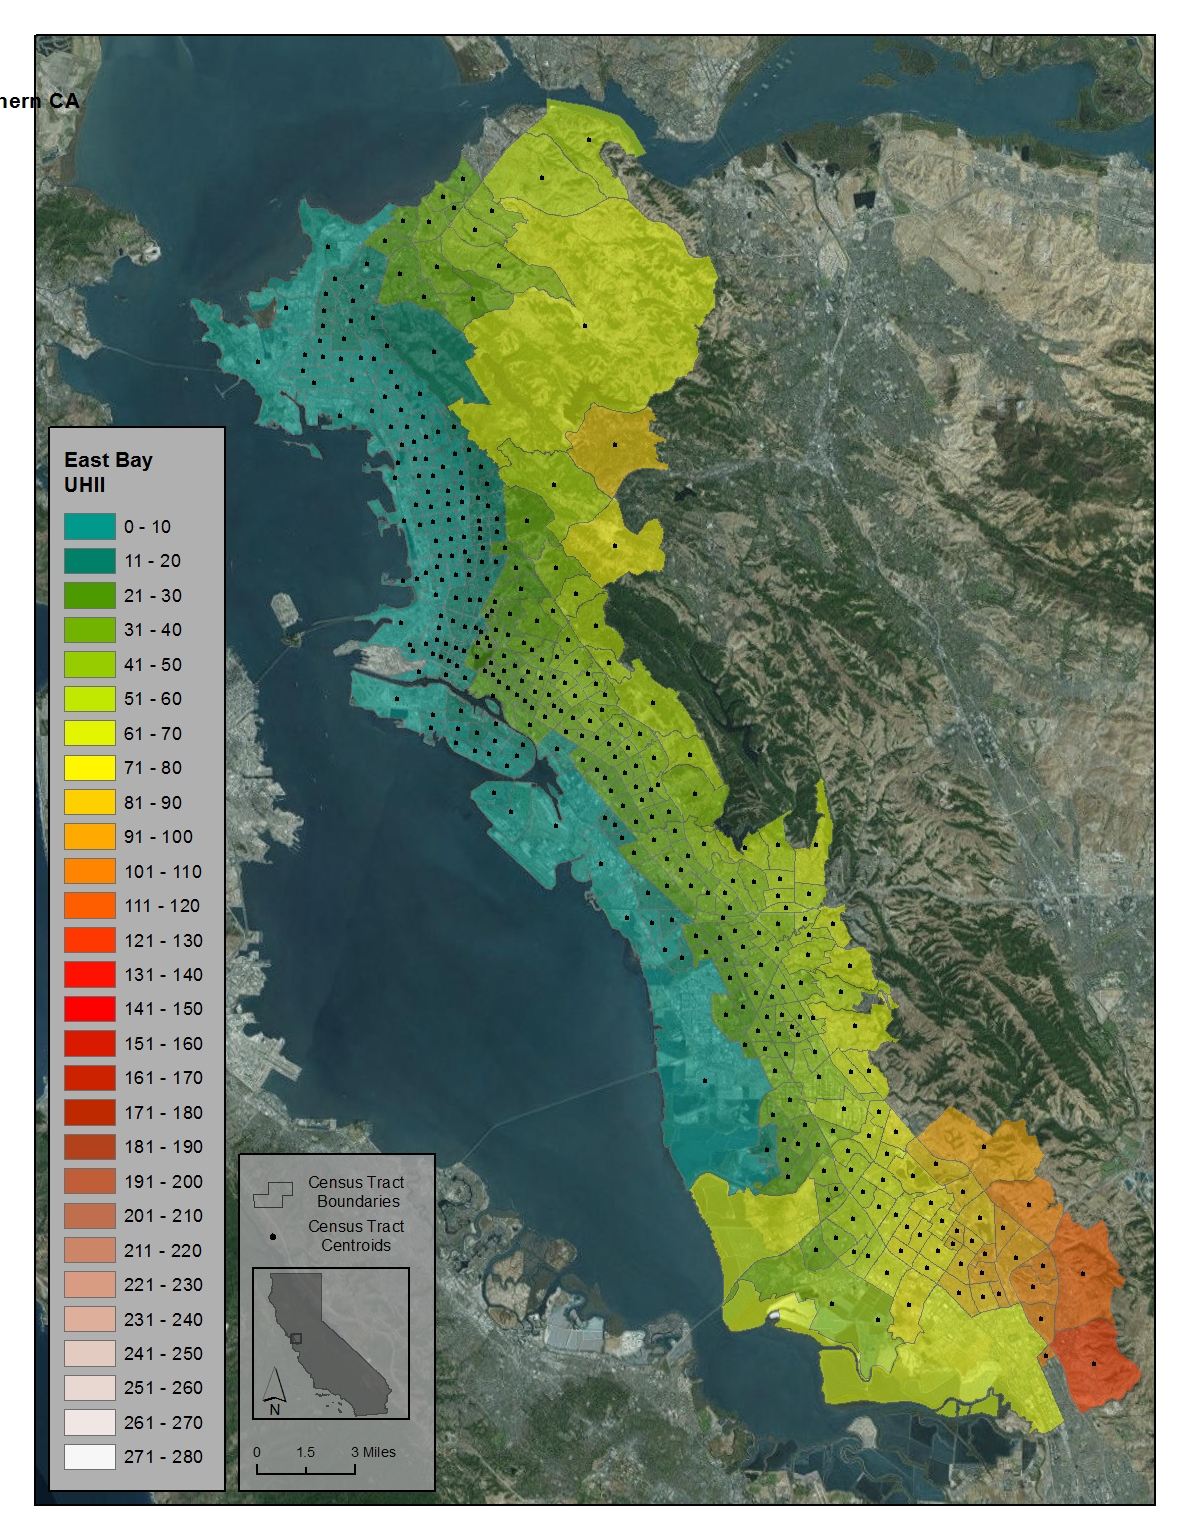
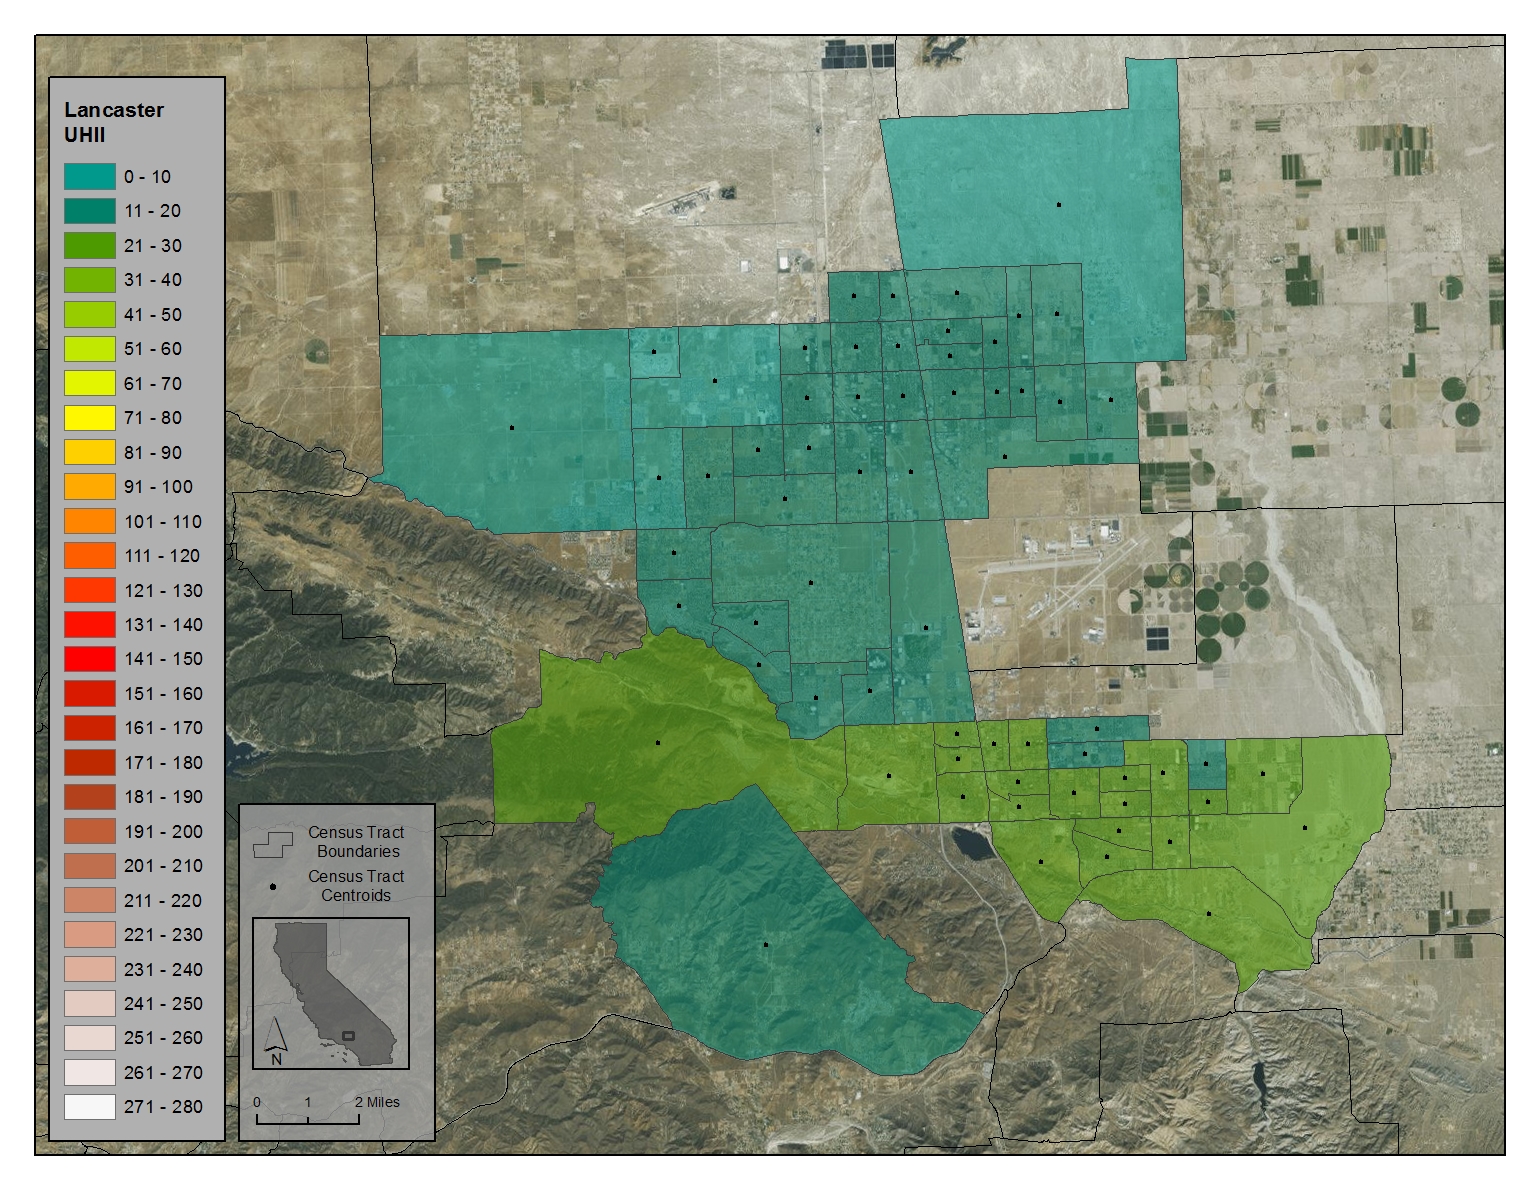
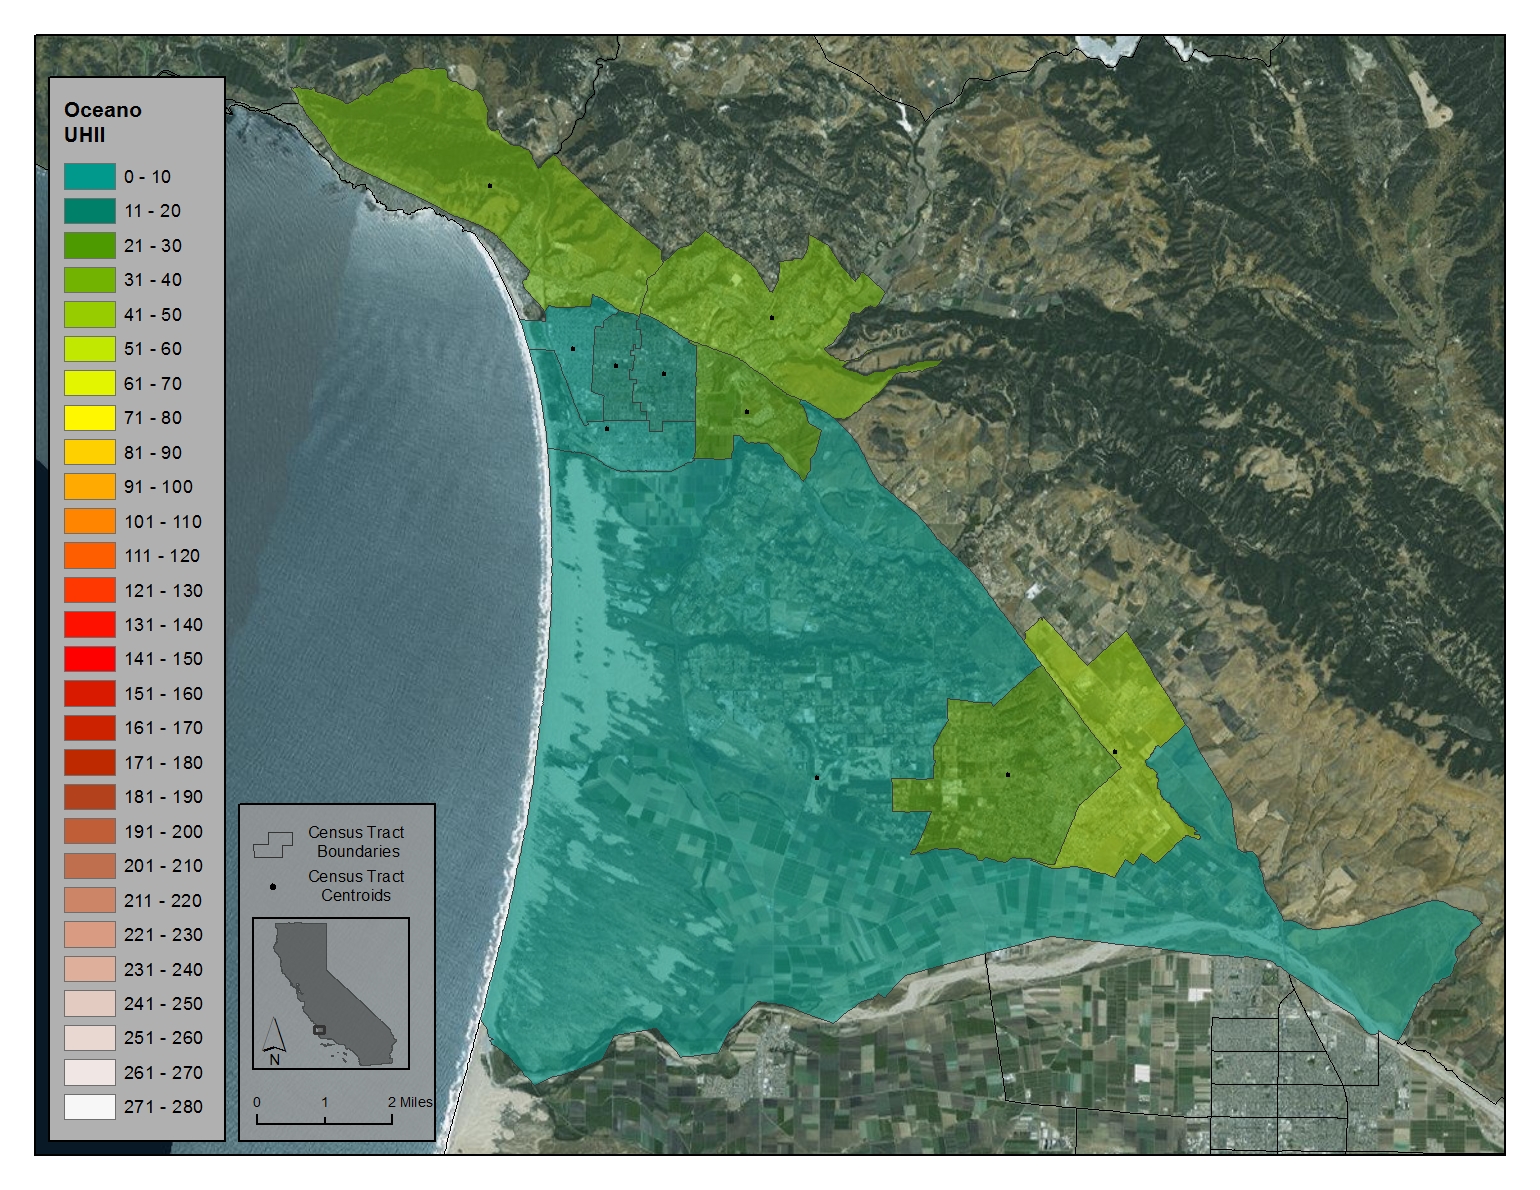
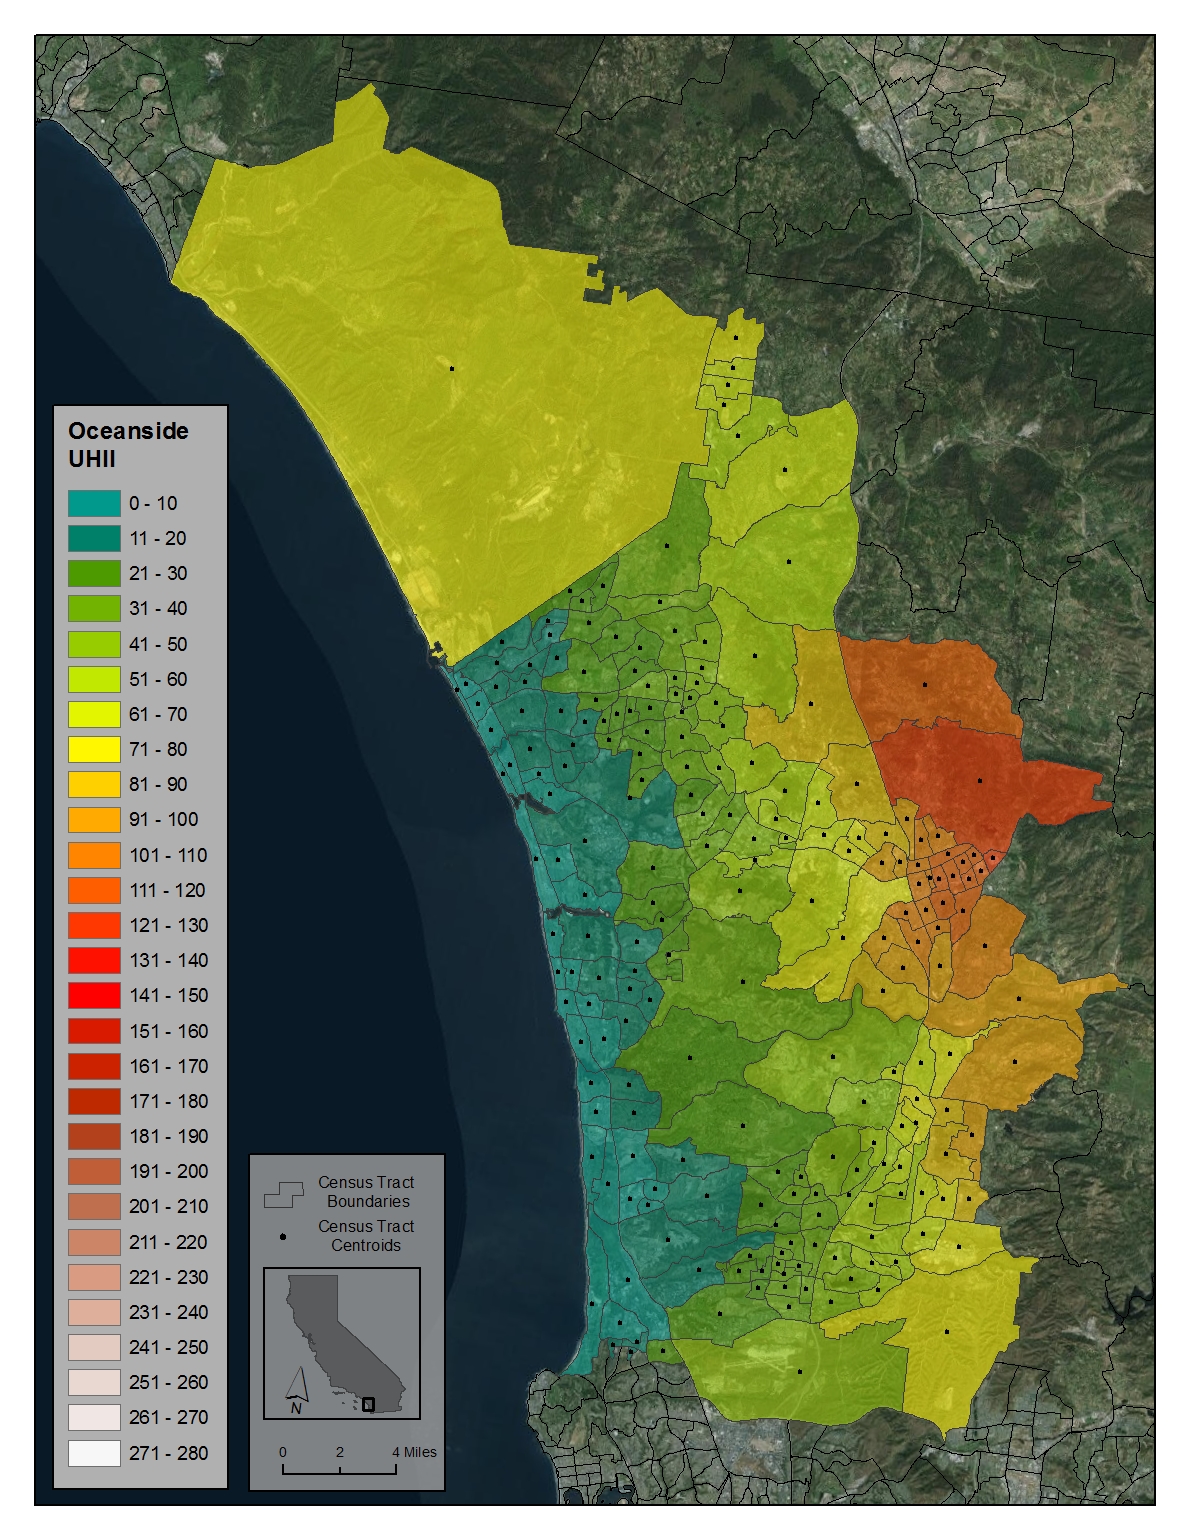
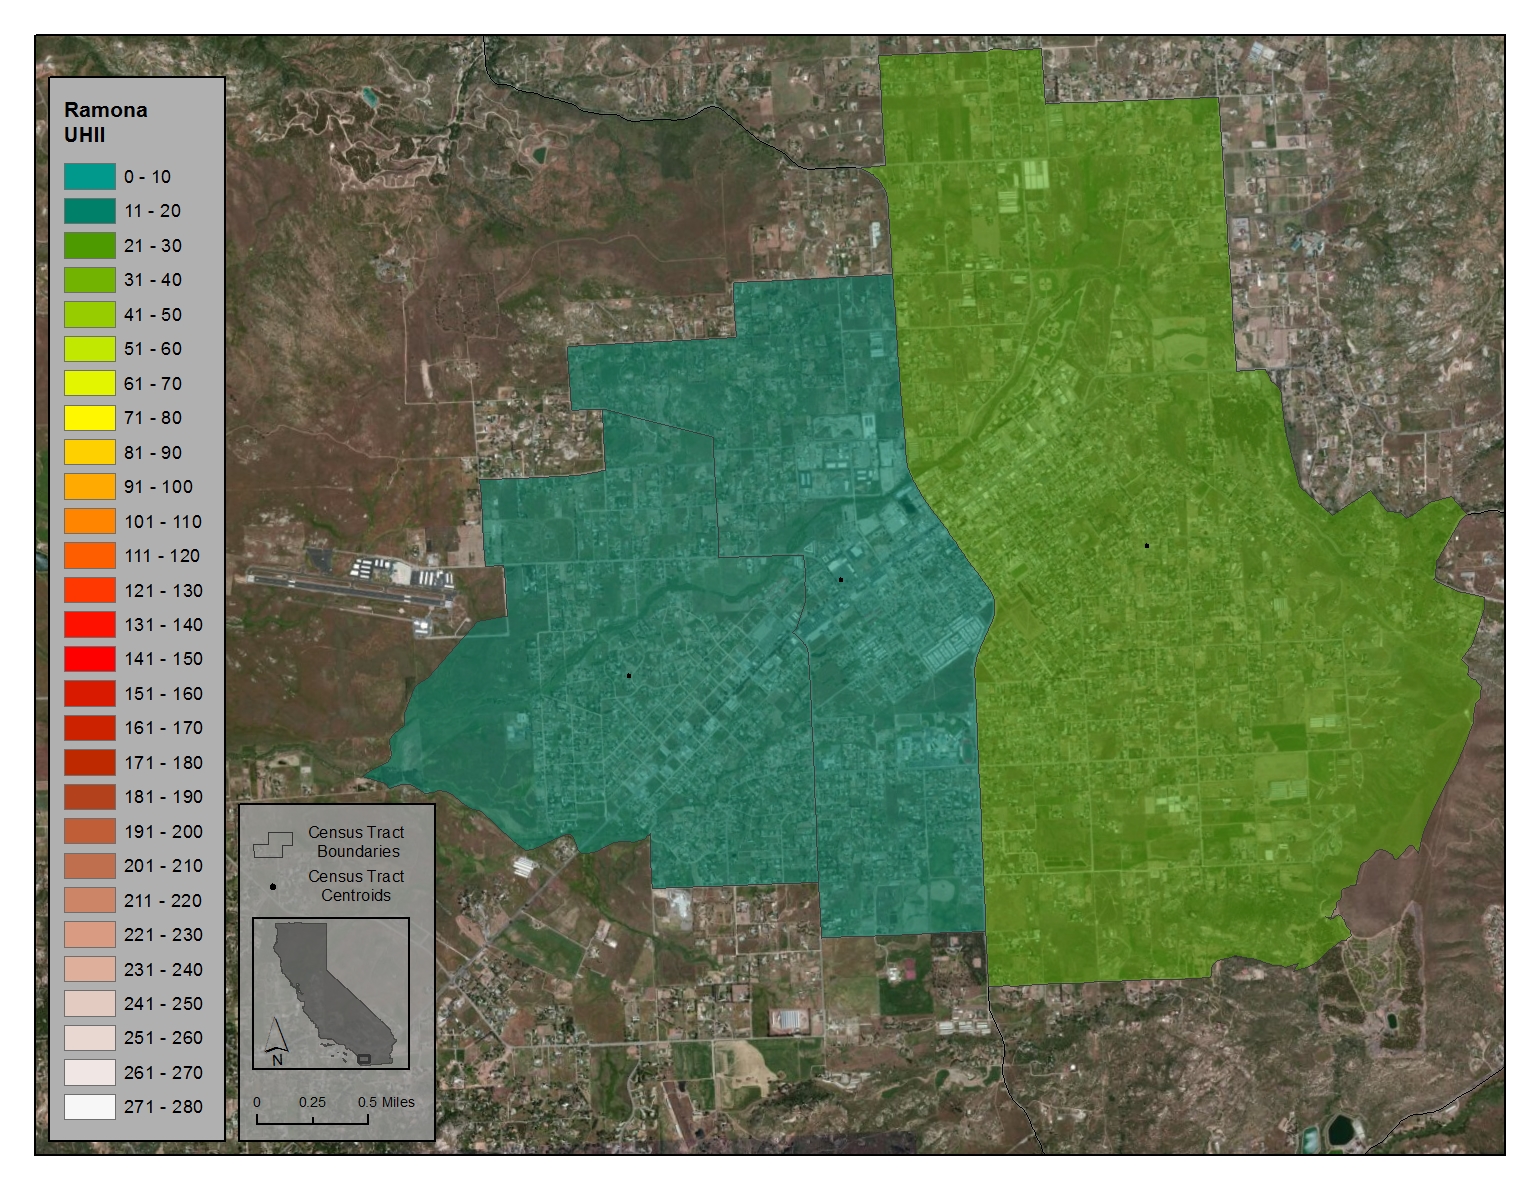
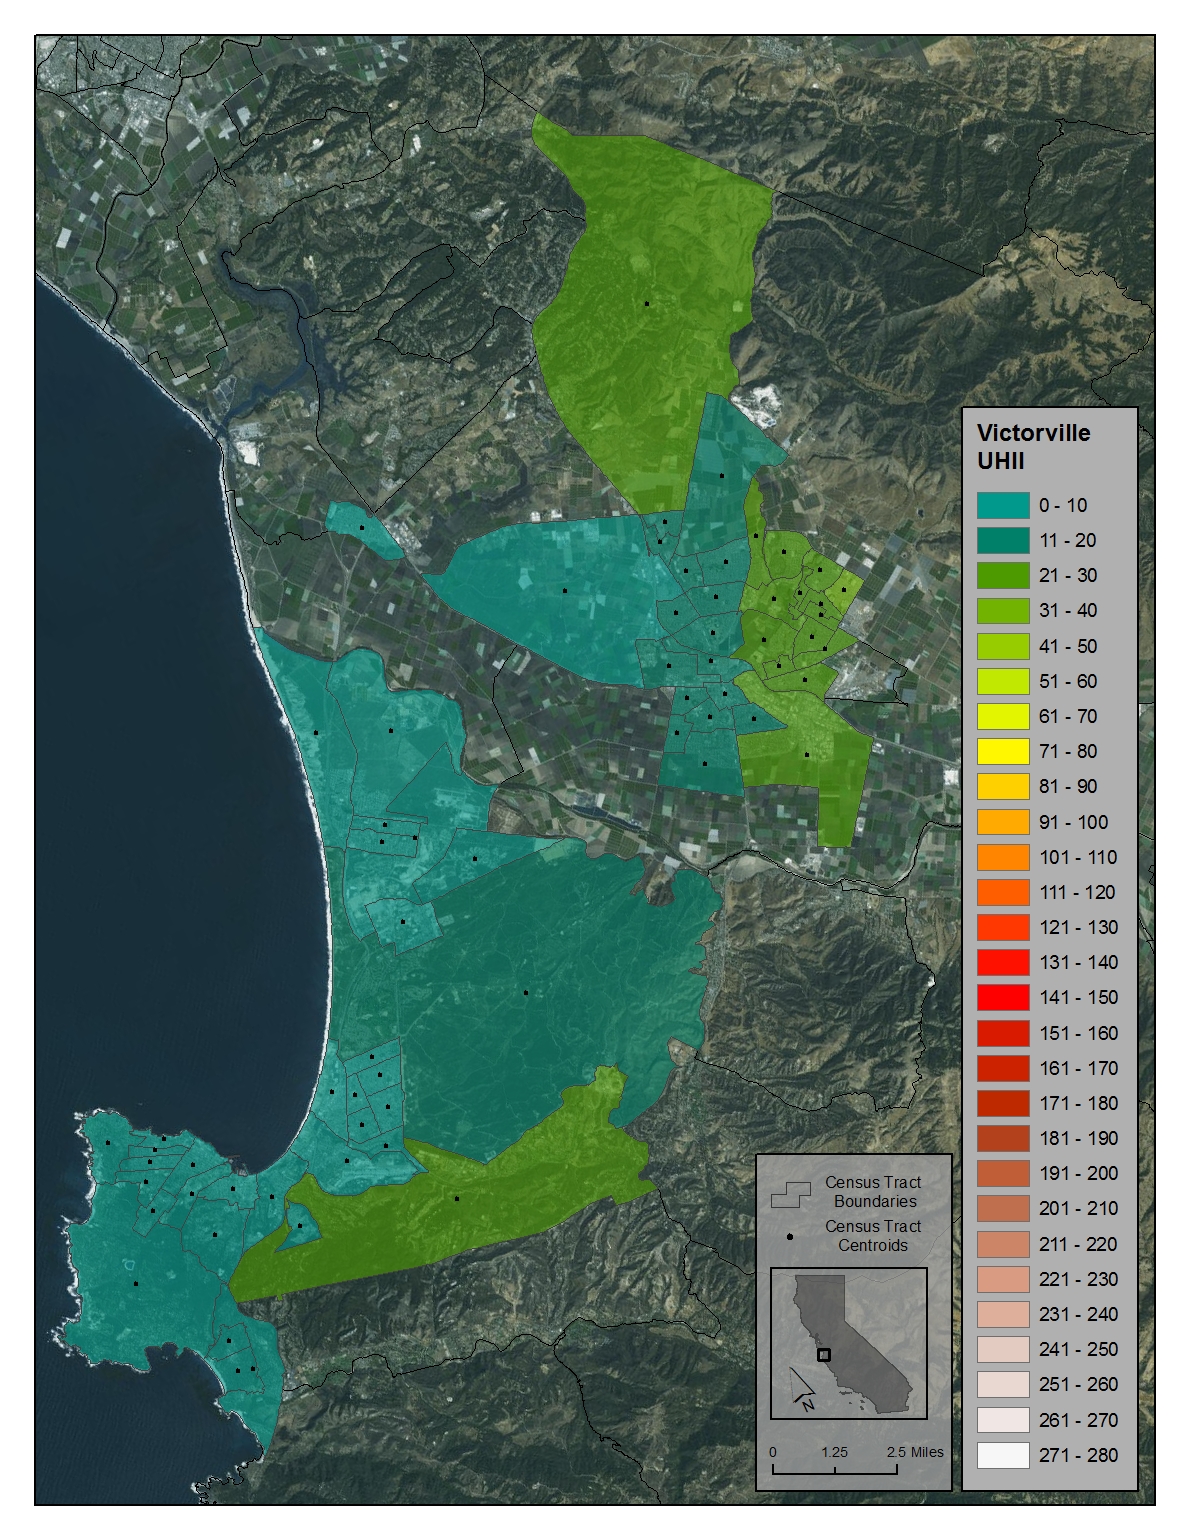
These interactive kmz maps shows urban heat islands in California as measured by the Urban Heat Island Index. The urban heat islands are color coded according to their intensity, with green representing the smallest effect and red to white representing the greatest intensity. If you click on a census tract, a popup box appears. The last row of the box, labeled “DegHourDay” indicates the Urban Heat Island Index in Celcius degree-hours per day.
The jpg map legend shows the range of intensity measured in Celcius degree-hours per day. For more information, including instructions on how to interact with the maps, please visit Urban Heat Island Home. If you need assistance, please contact
Office of the Secretary
California Environmental Protection Agency
1001 I Street
P.O. Box 2815
Sacramento, Ca 95812
Climate Change Advisor
(916) 445-0039

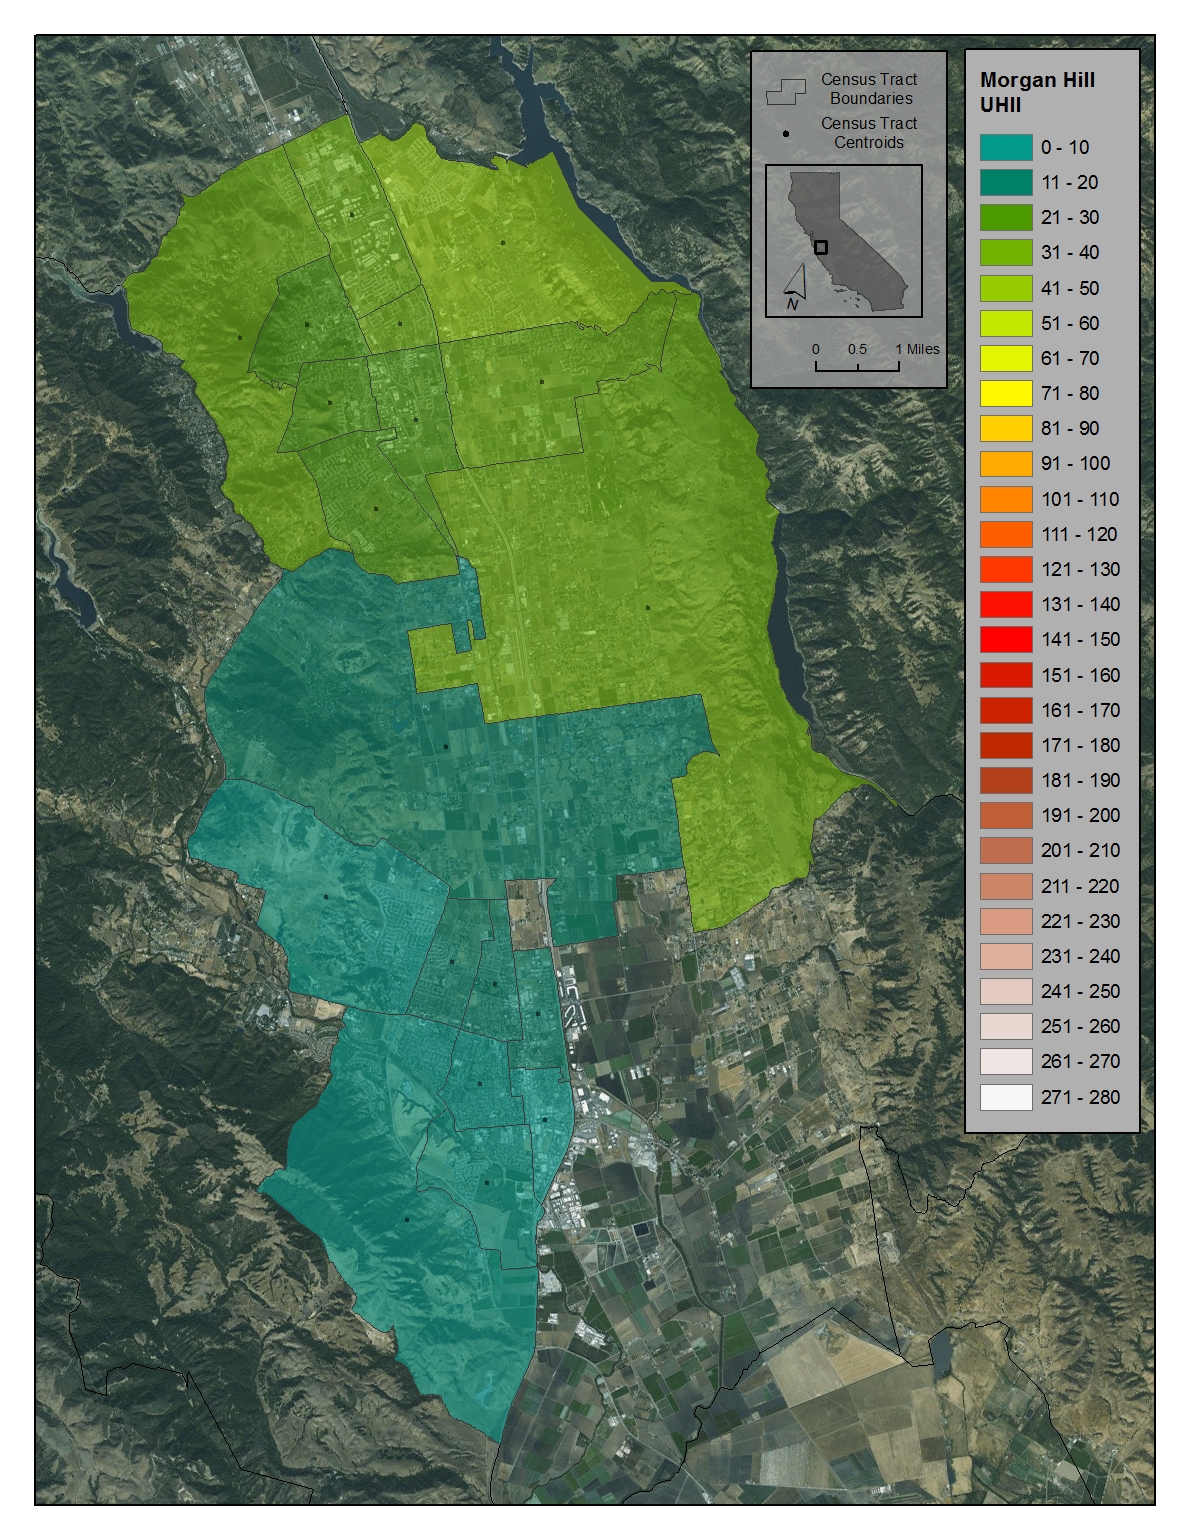
13_Morgan_Hill
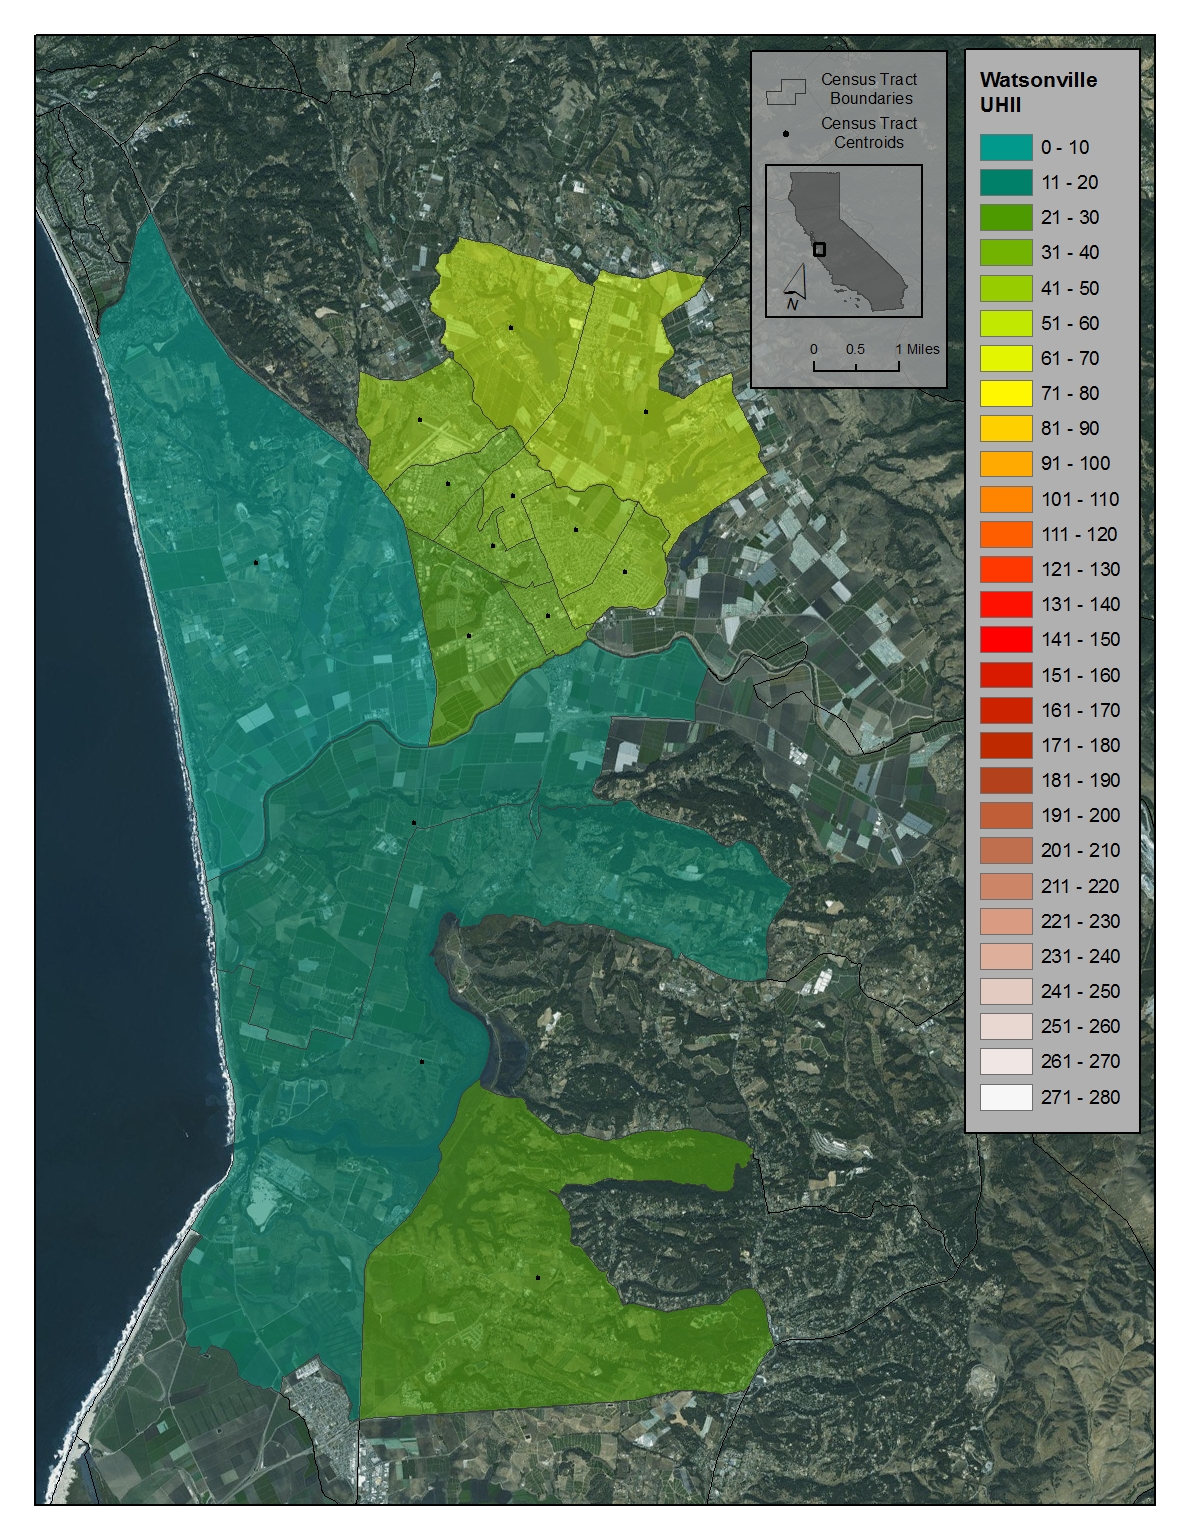
14_Watsonville
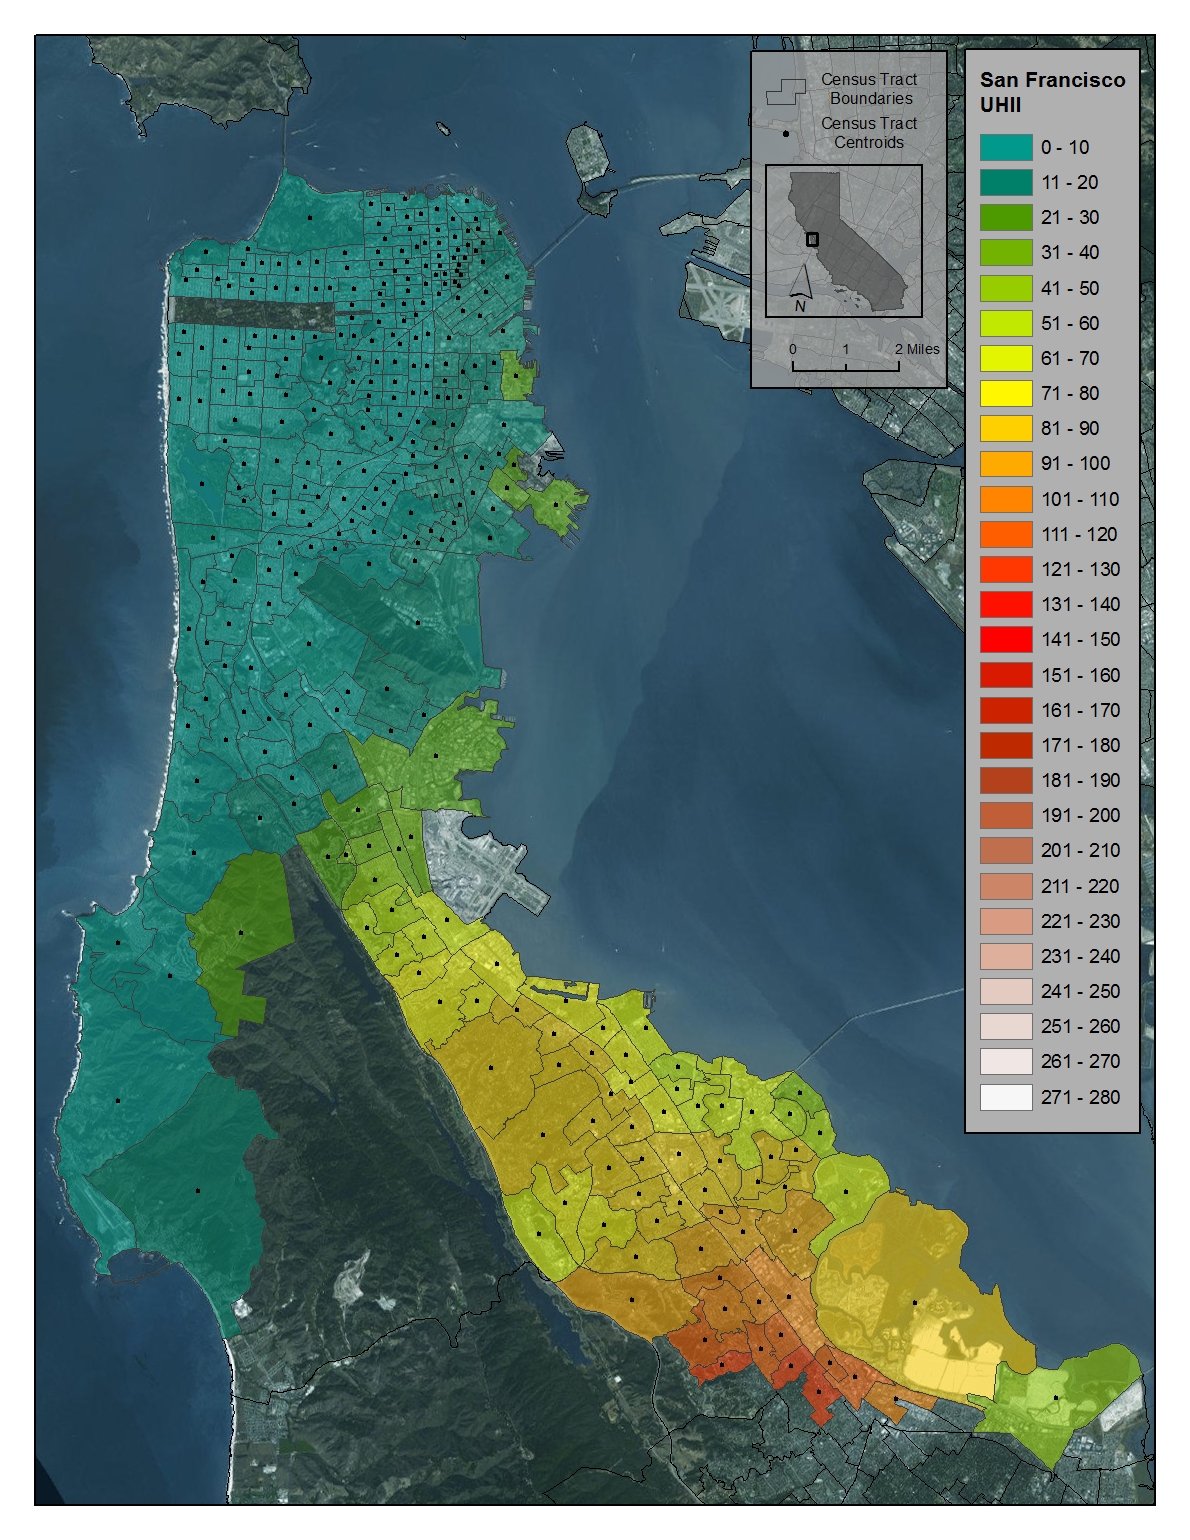
18_San_Francisco
21_Walnut_Creek
23_Bakersfield
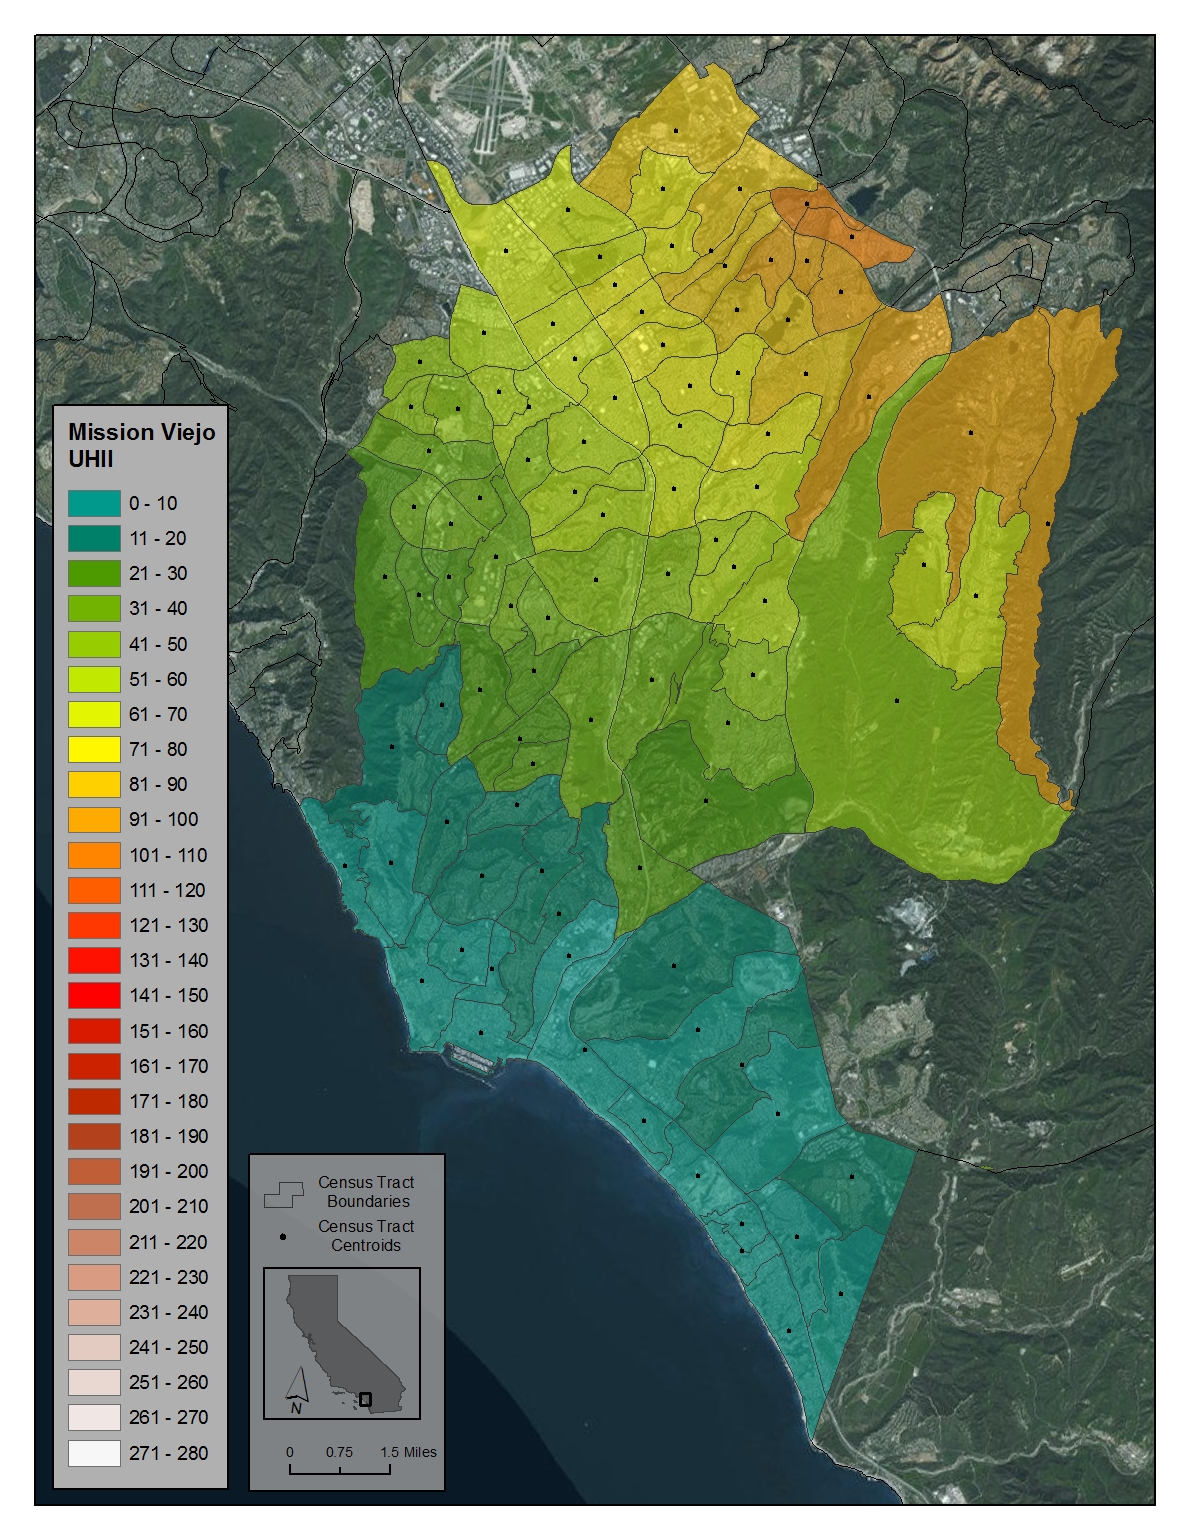
28_Mission_Viejo

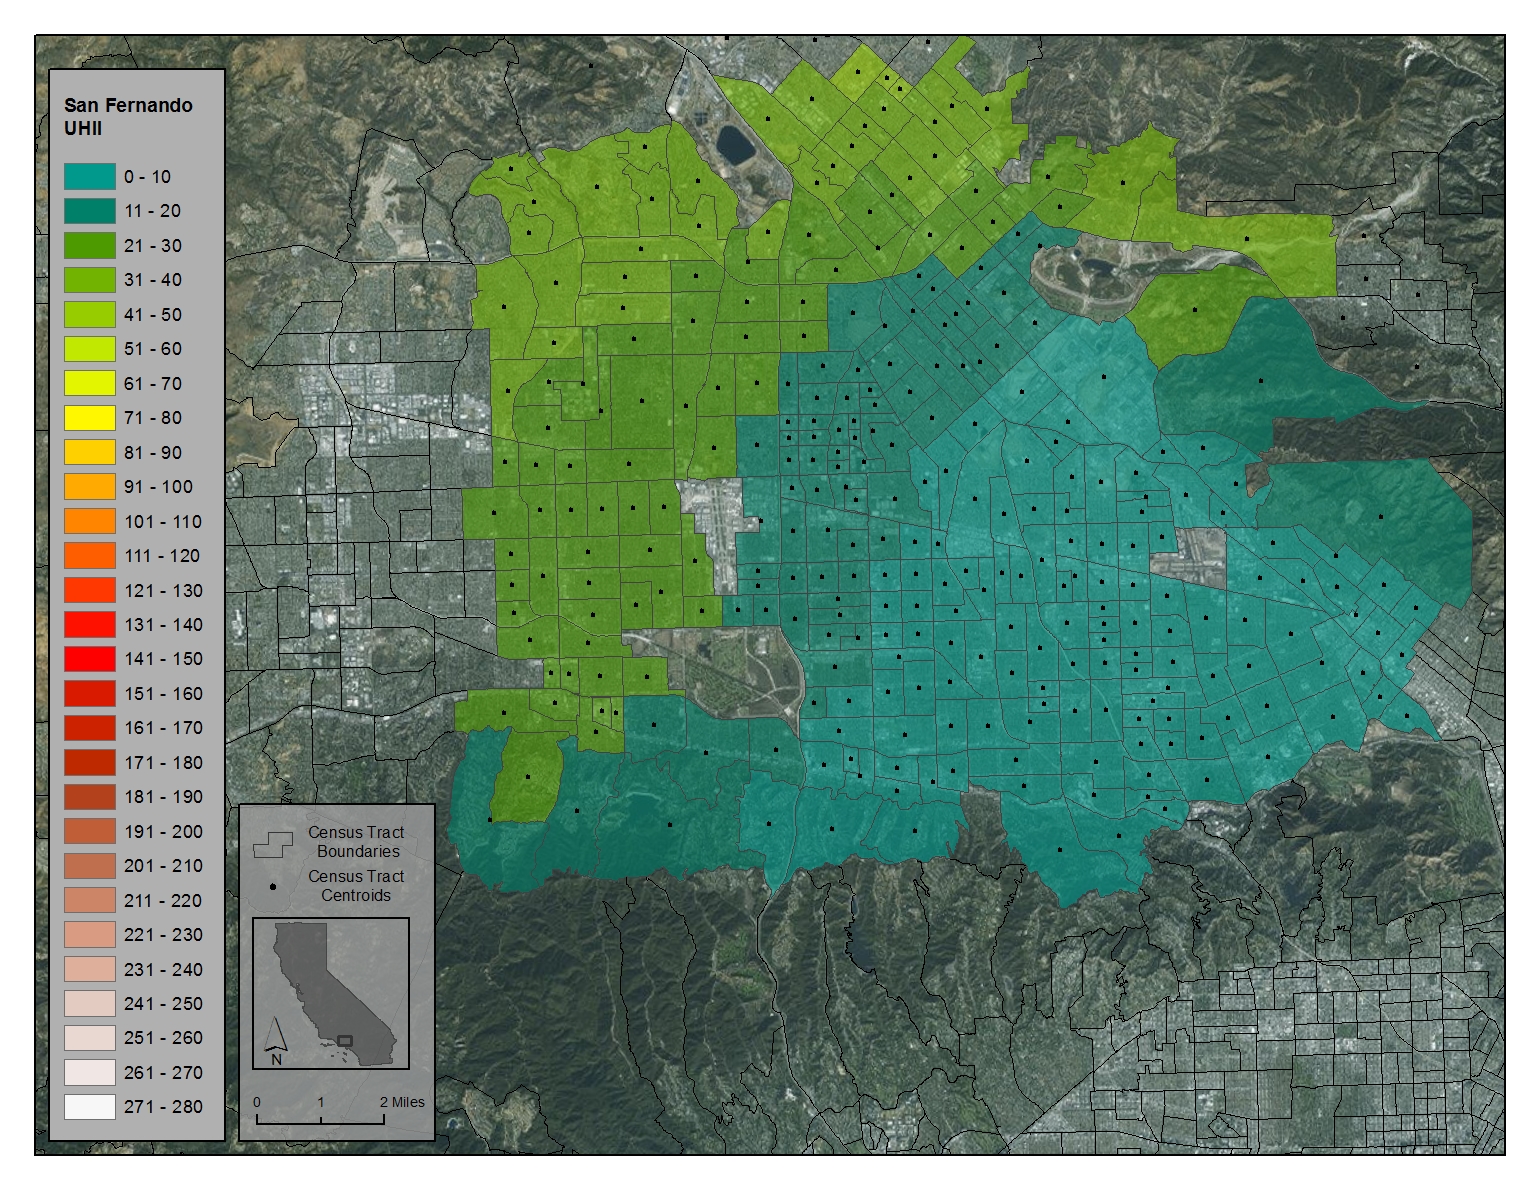
34_San_Fernando
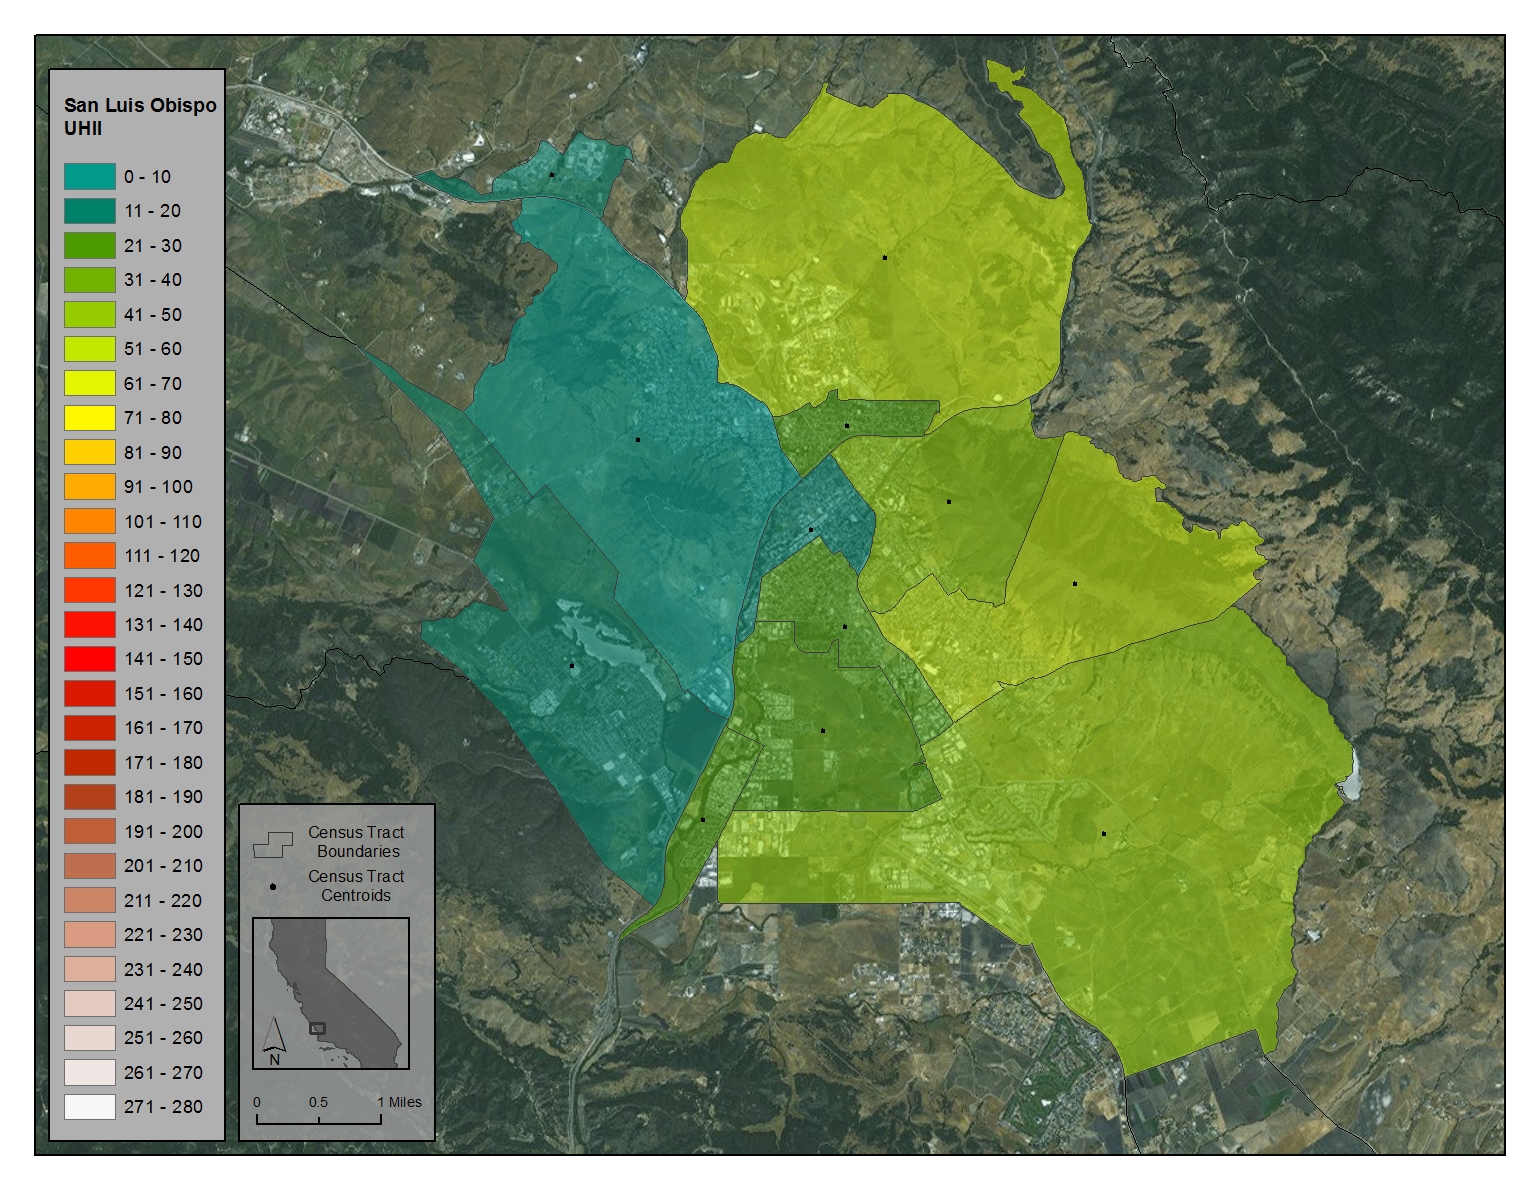
35_San_Luis_Obispo
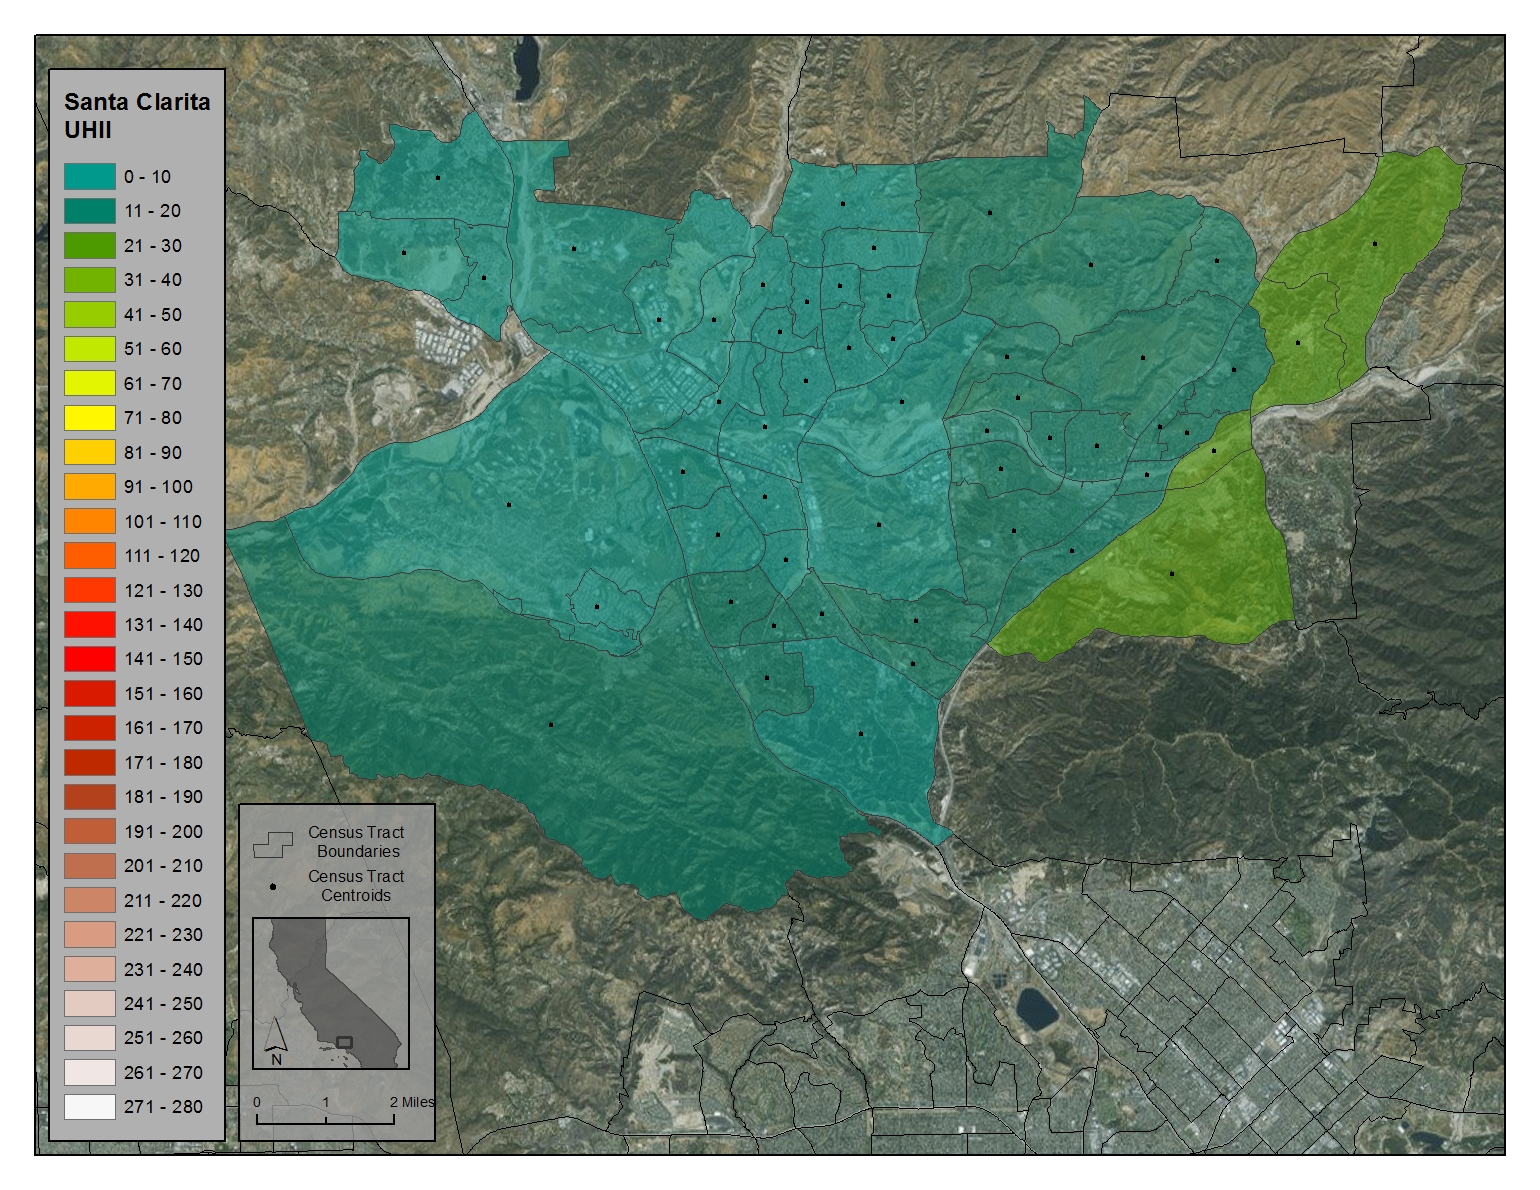
36_Santa_Clarita
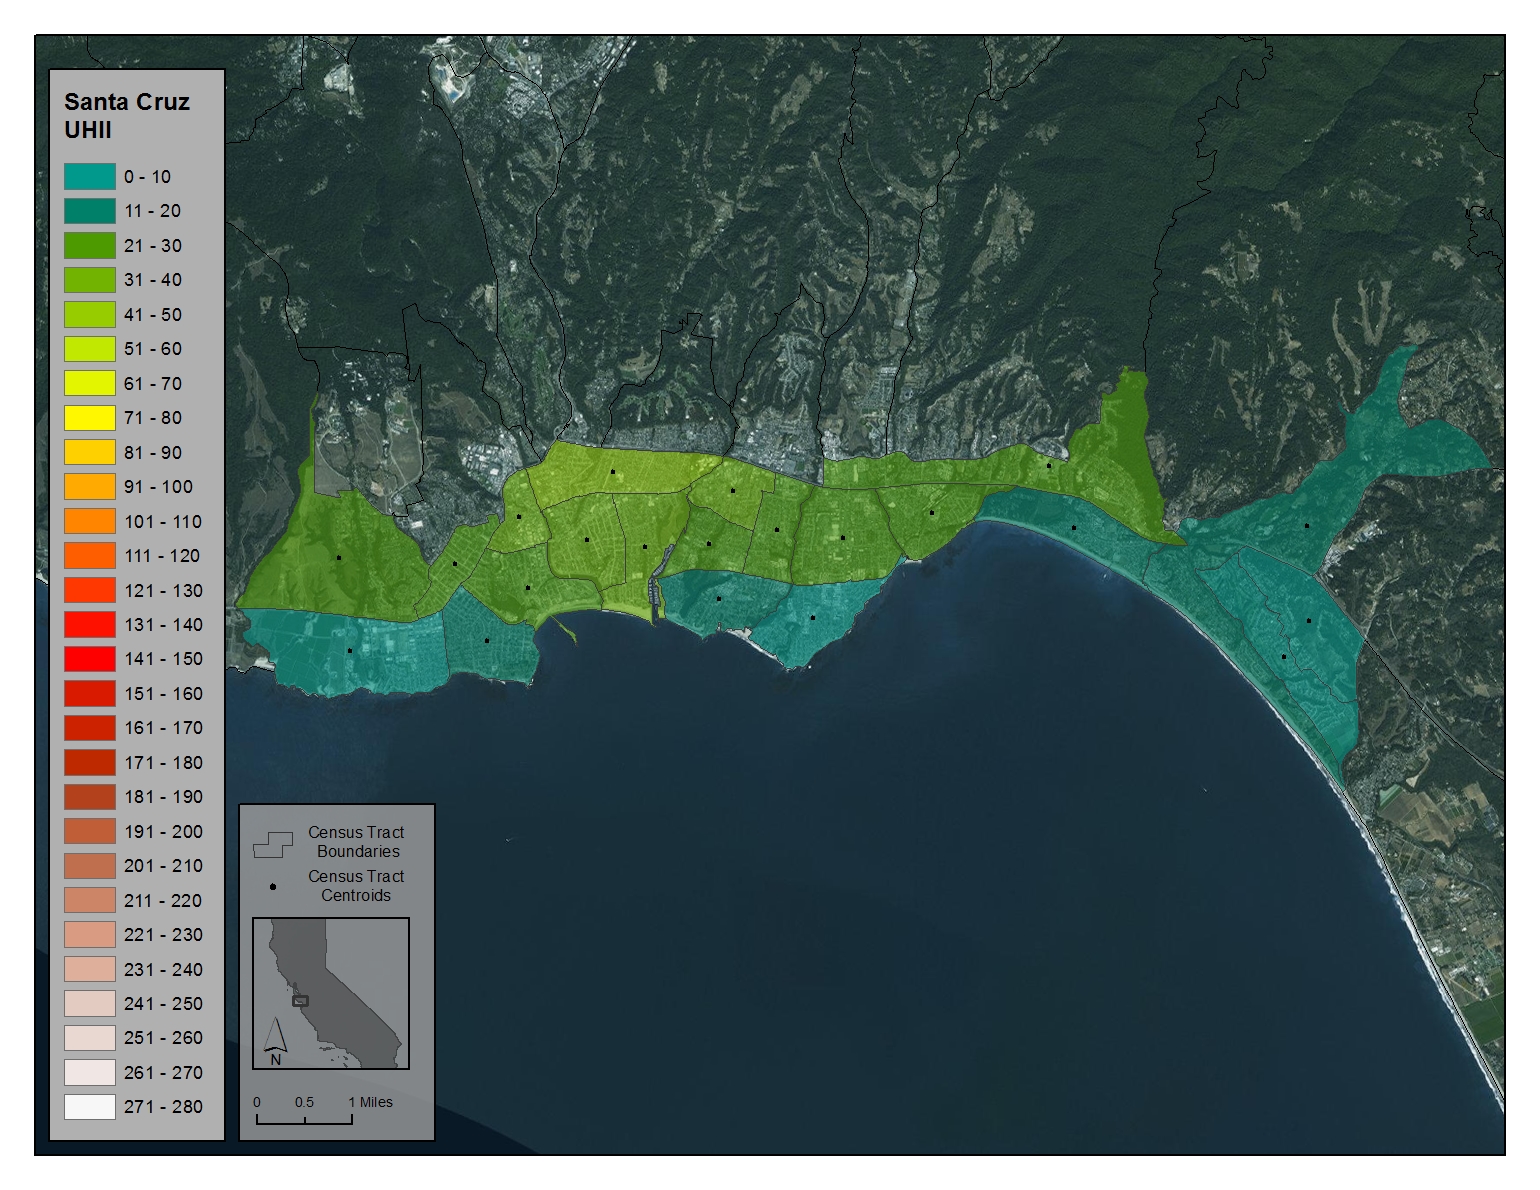
37_Santa_Cruz
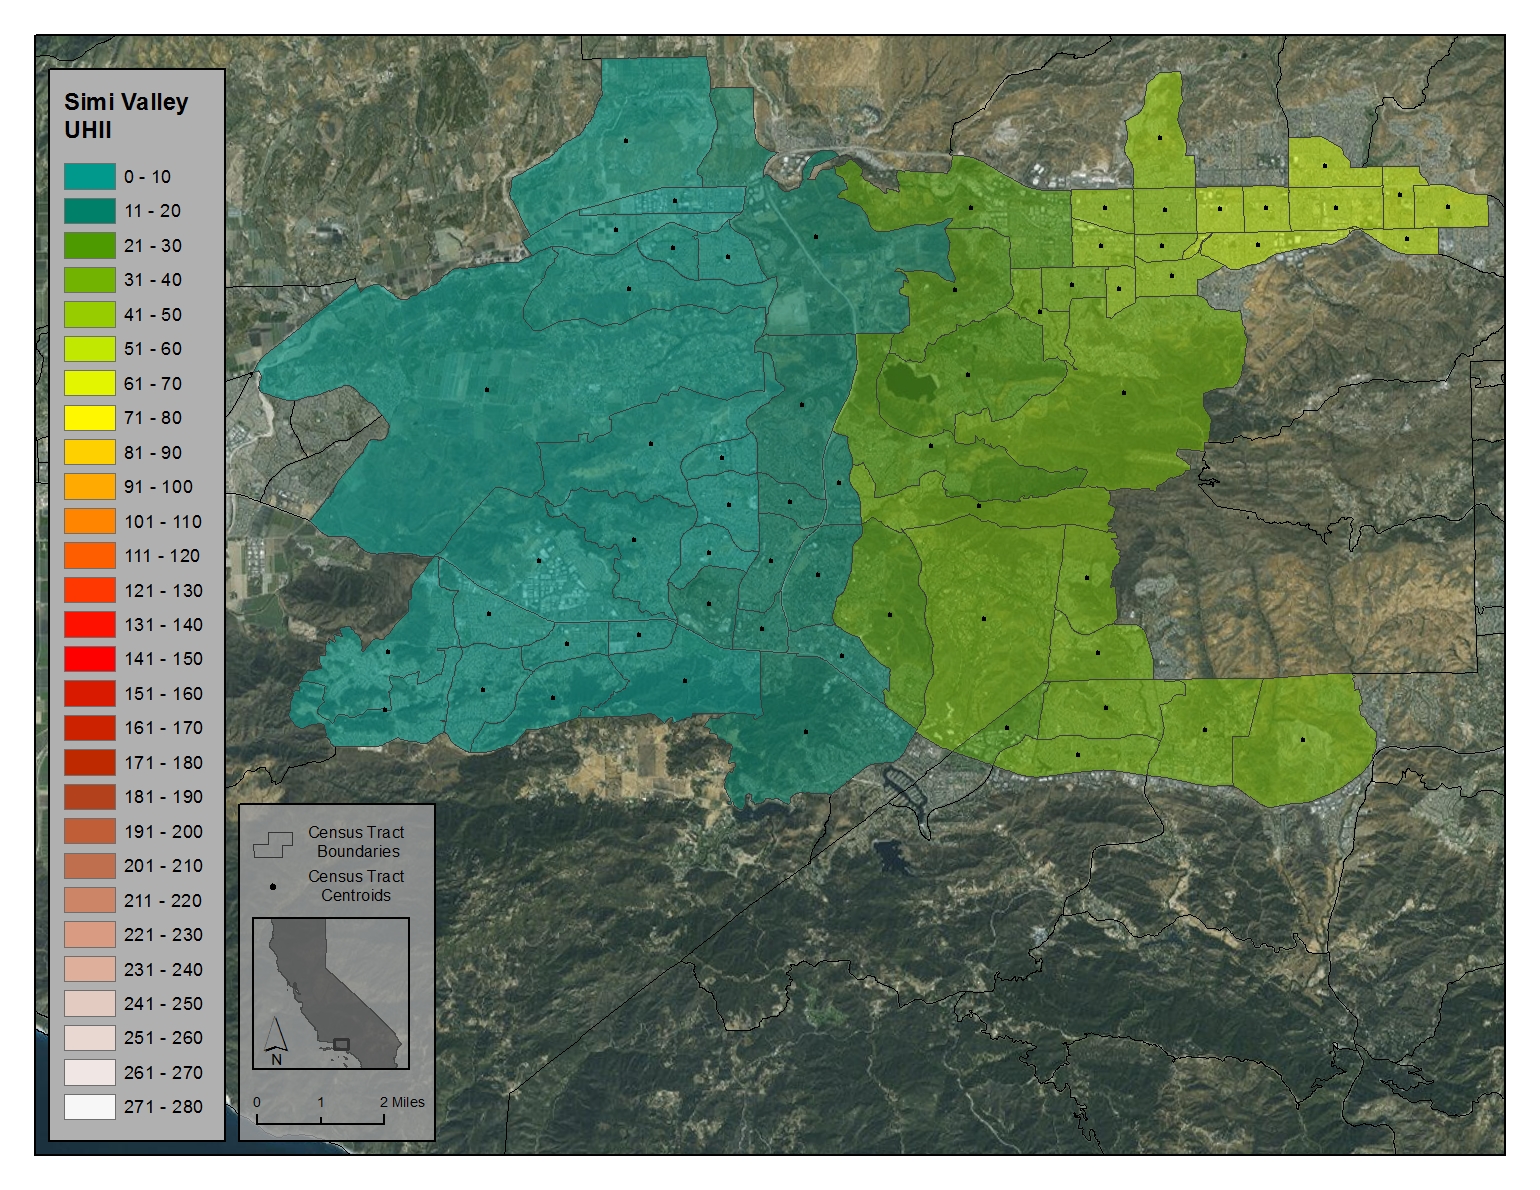
38_Simi_Valley
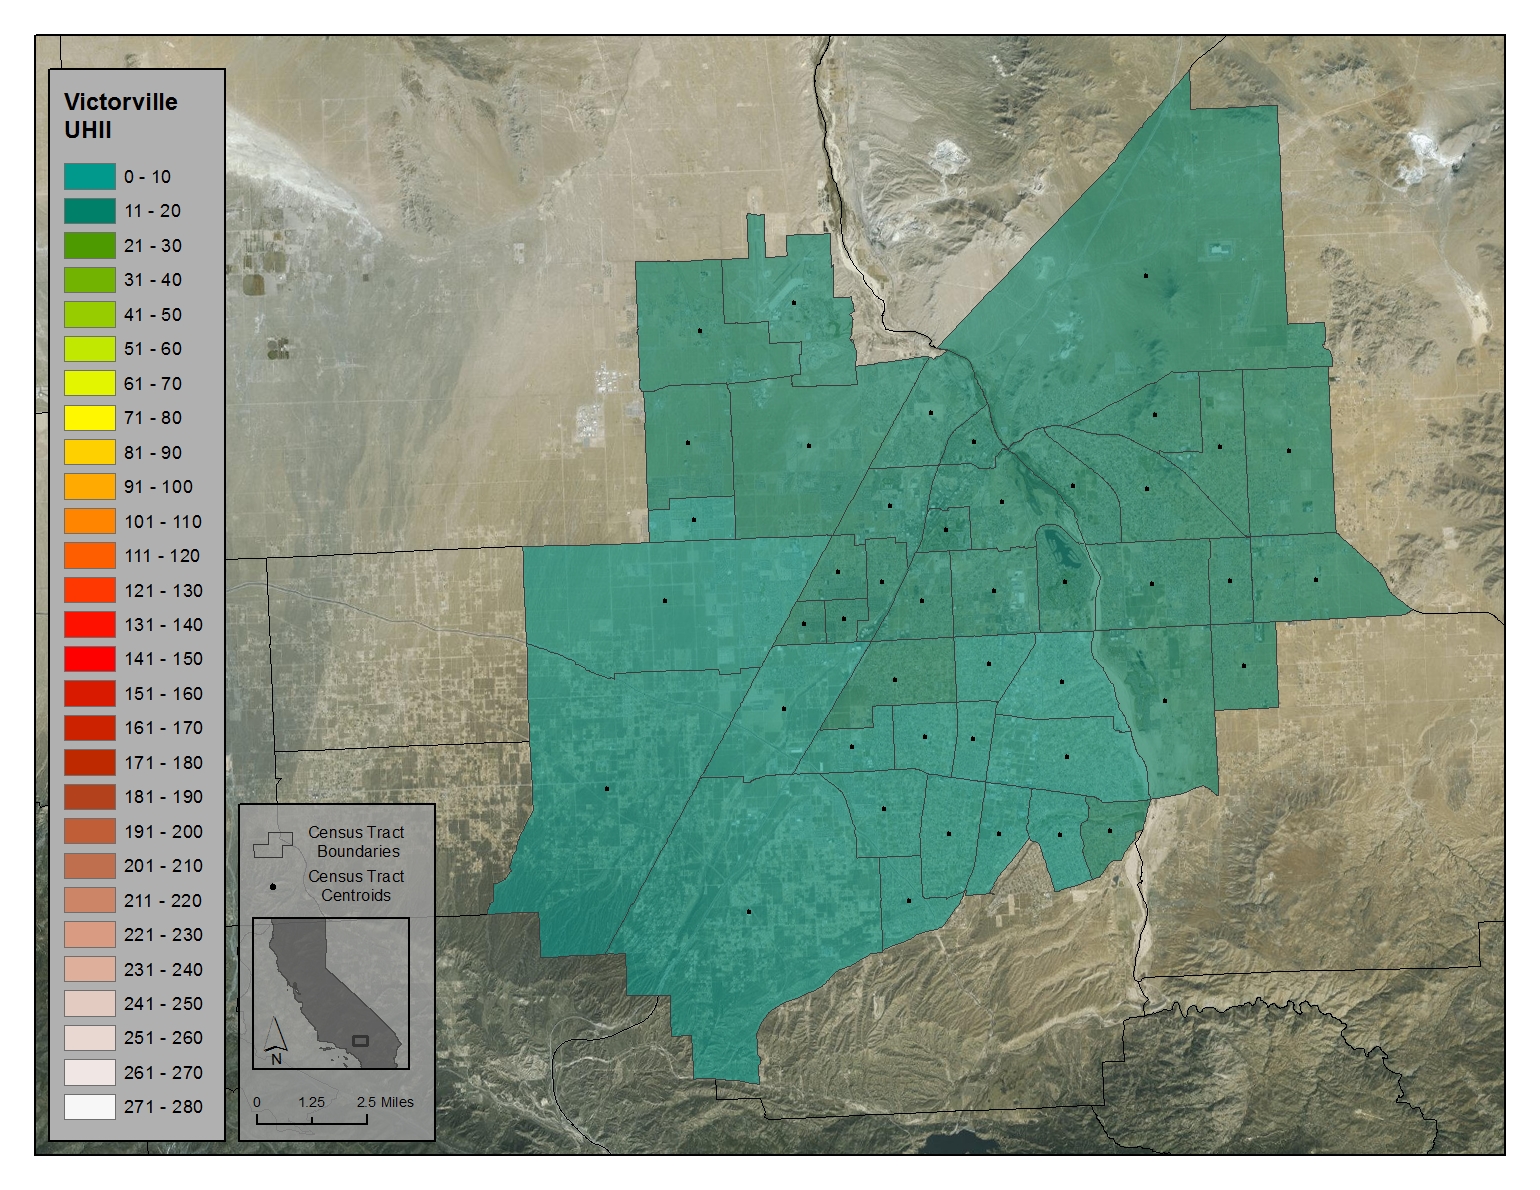
39_Victorville